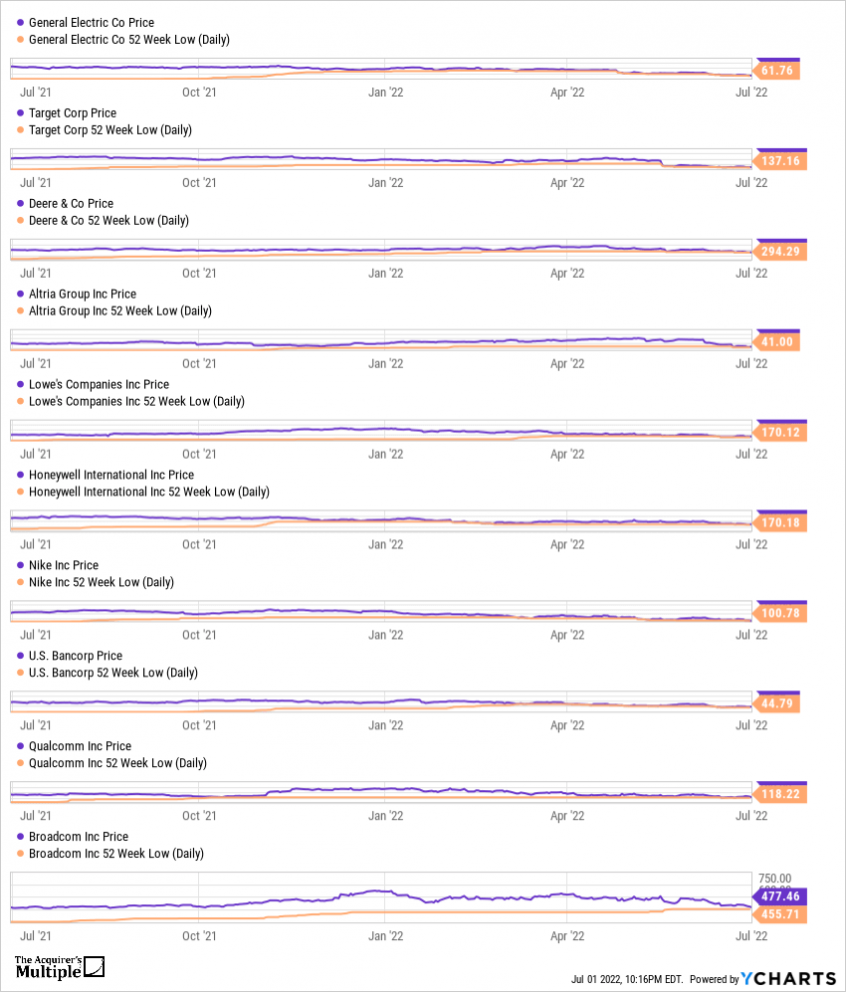
Over the past twelve months a number of big named companies have been near or below their 52 week low price. Each week we’ll take a look at 10 of the biggest names currently close to their 52 week lows: 1. General Electric Co (GE): Current Price $63.53/52 Week Low … Read More
Another 10 Big Named Companies Near 52 Week Lows
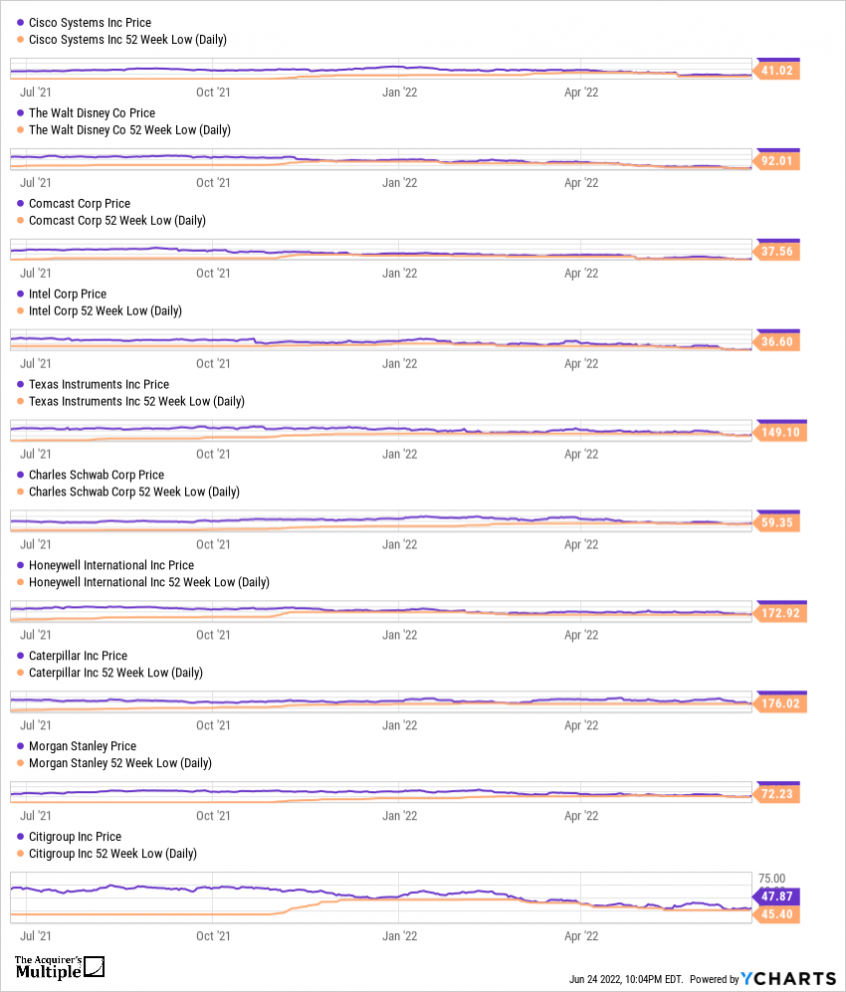
Over the past twelve months a number of big named companies have been near or below their 52 week low price. Last week we named 10 of the biggest names close to 52 week lows. This week we’ll take a look at another 10 of the biggest names currently close … Read More
10 Big Named Companies Near 52 Week Lows
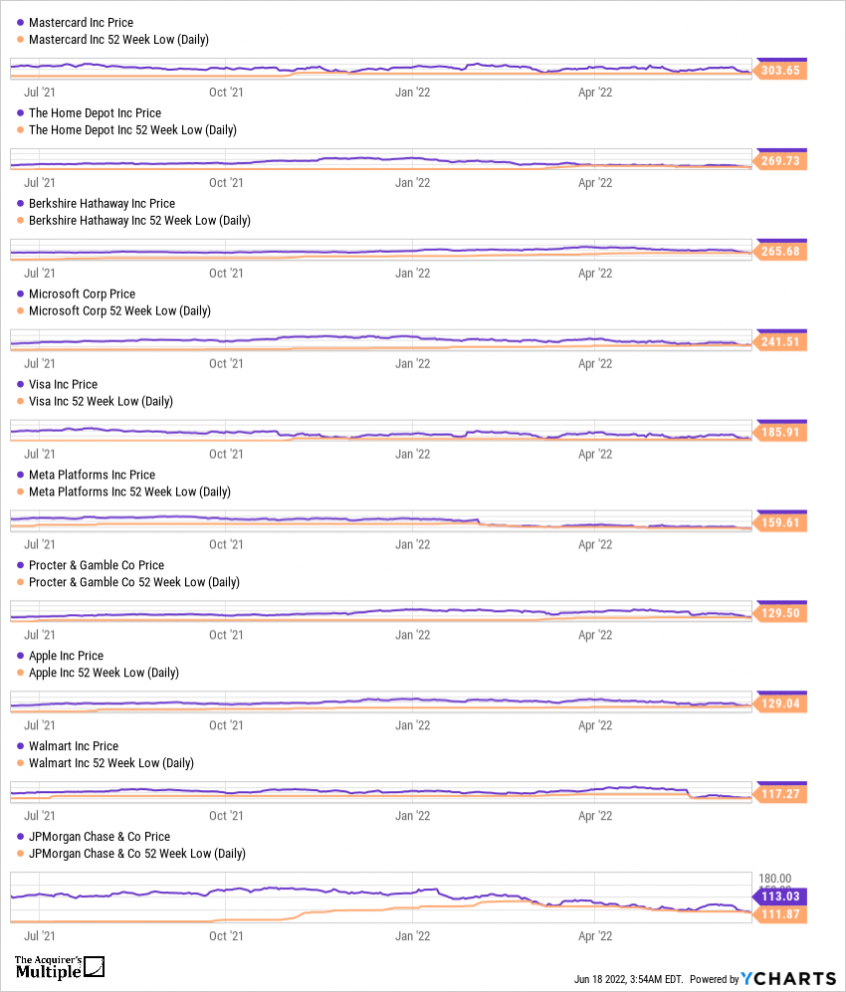
Over the past twelve months a number of big named companies have been near or below their 52 week low price. Here’s 10 of the biggest names currently close to their 52 week lows: 1. Mastercard Inc (MA) – Current Price $310.69/52 Week Low $303.65 2. The Home Depot Inc … Read More
Top 10 Mega-Cap Stocks Last 12 Months – @ycharts
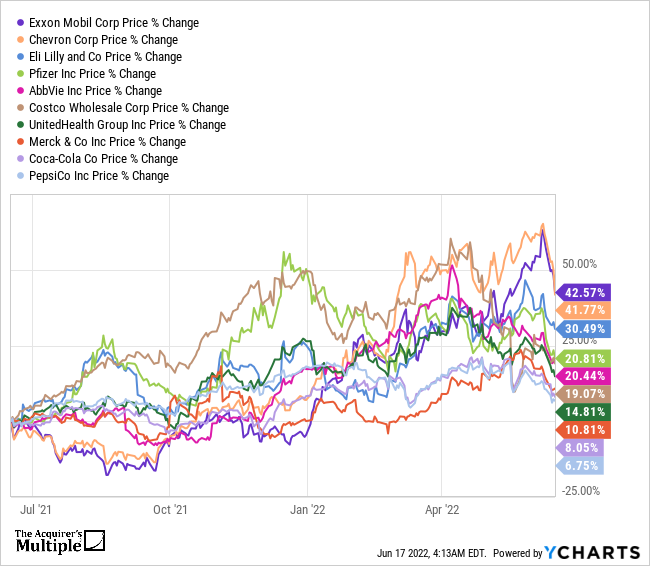
Over the past twelve months ten Mega-Cap stocks have outperformed all others. Mega-Caps as defined by $200 Billion Market Cap or more. Here’s the top 10: 1. Exxon Mobil Corp (XOM) – Up 42.57% 2. Chevron Corp (CVX) – Up 41.77% 3. Eli Lilly and Co (LLY) – Up 30.49% … Read More
Finding Nuggets In The Most Underperforming Places
If you’ve been watching the stock market closely over the past 12 months you’ll know that the worst performing sector is Communication Services, which is down 28.86%. However, as is always the case, looking in the most underperforming places can uncover some great companies. This week we’ve uncovered 5 companies … Read More
What A Difference 12 Months Makes @ycharts
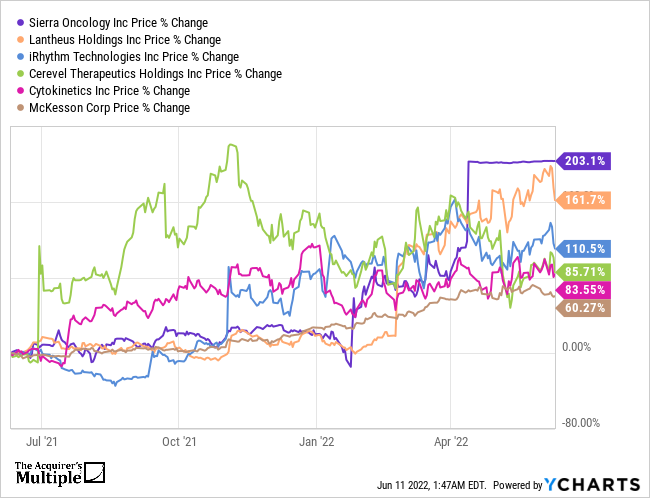
One of the best performing sectors over the past twelve months has been the Healthcare Sector, up 3.4%. Within the Heathcare Sector a number of stocks have outperformed but this week we focus on five of these companies that have gained more than 60% in the past twelve months. What … Read More
What A Difference 12 Months Makes @ycharts
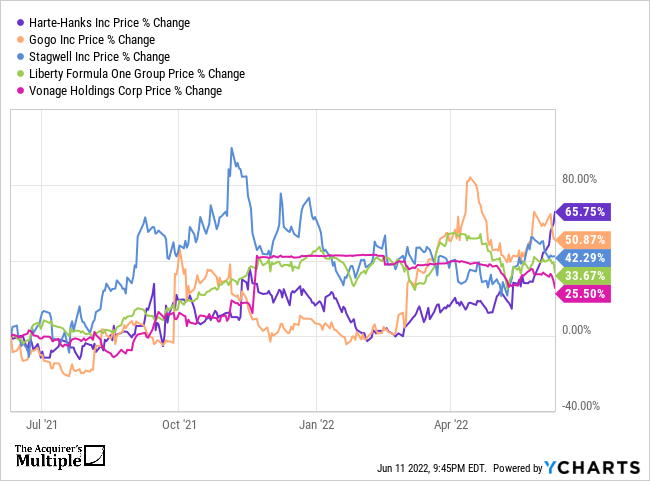
Last week we took at look at one of the most underperforming sectors in the past 12 months, Internet Content and Information. This week we take a look at five stocks that have gained more than 200% over the past 12 months, and its no surprise that all five companies … Read More
Chamath Palihapitiya’s 4 Major SPAC Deals Performance Last 12 Months @ycharts
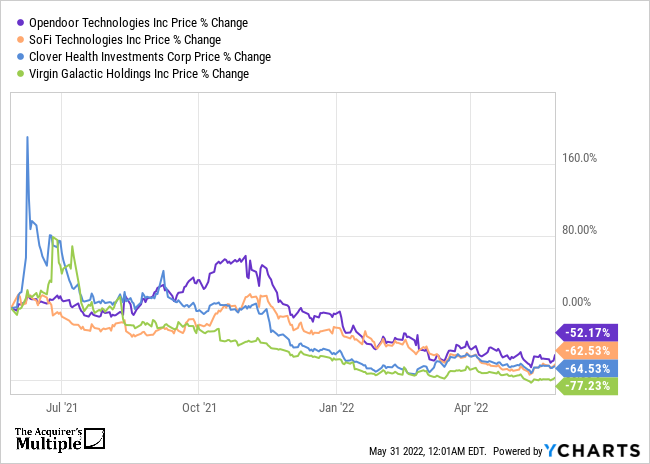
As part of a new weekly feature here at the Acquirer’s Multiple we’ll be providing some of our favorite charts of the week from @ycharts. This week we take a look at Chamath Palihapitiya’s 4 major SPAC deals performance for the last twelve months. Companies – Underperformance % Opendoor Technologies … Read More
What A Difference 12 Months Makes @ycharts
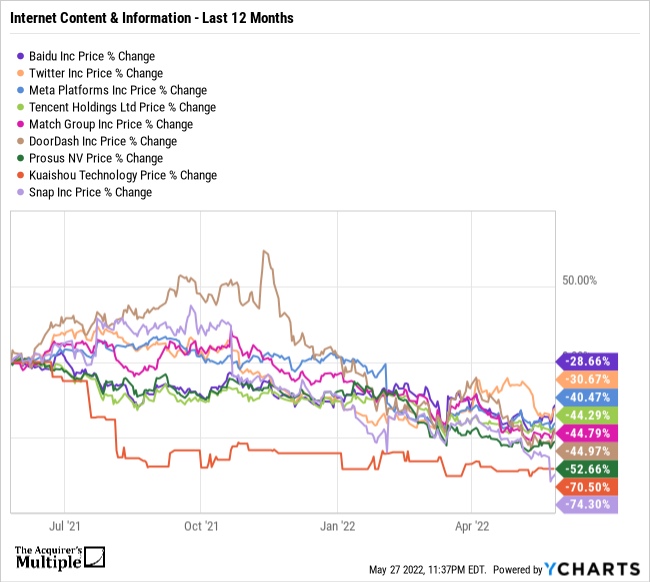
In the past twelve months, one sector has underperformed all others, and that is Communication Services, down 25.13%. Within that sector one group of companies has significantly underperformed, and that is Internet Content and Information. Here’s a list of some of the worst performing stocks in Internet Content and Information. What … Read More
What A Difference 12 Months Makes @ycharts
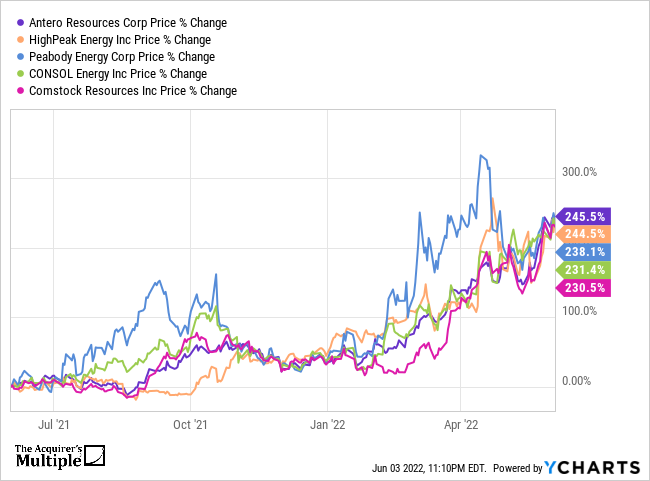
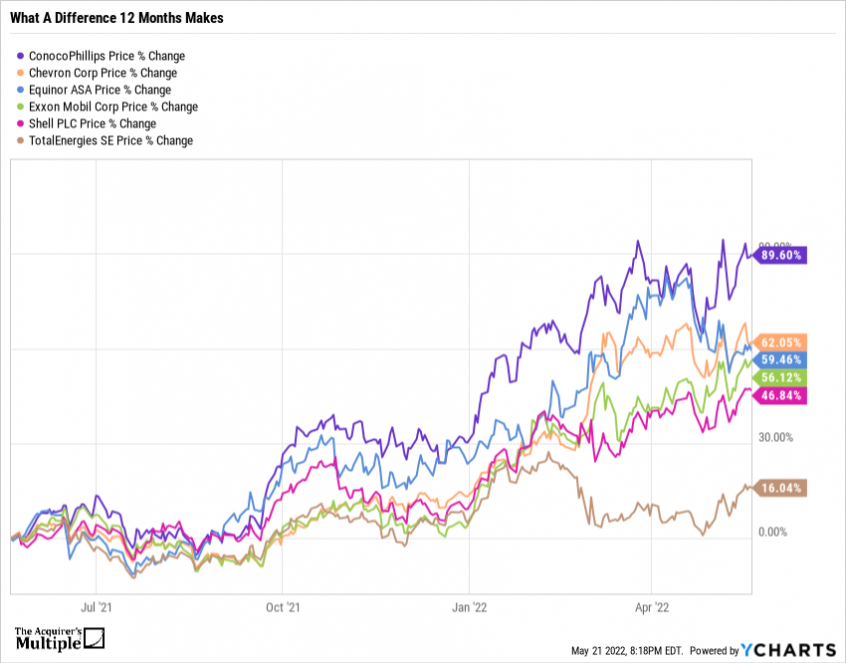
In the past twelve months, one sector has outperformed all others, and that is Energy. Here’s a list of some of the top performing stocks in the Energy sector. What a difference 12 months makes. Company – Price % Change Last 12 Months ConocoPhillips (COP) – Up 89.60% Chevron Corp … Read More
Constellation Software (CSU.TO) vs Berkshire Hathaway (BRK.A) – Head To Head @ycharts
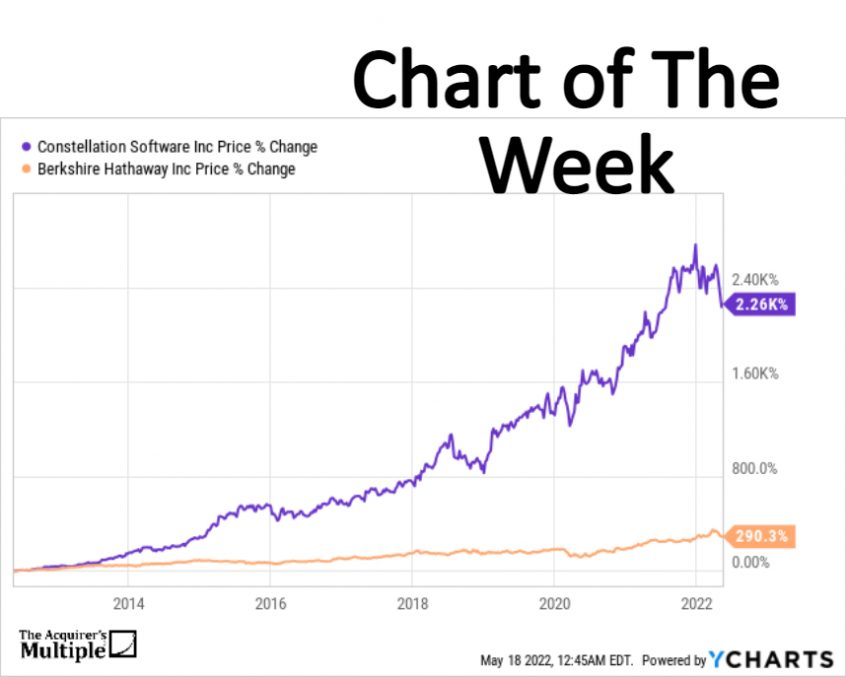
As part of a new weekly feature here at the Acquirer’s Multiple we’ll be providing some of our favorite charts of the week from @ycharts. This week we’ll take a look at Constellation Software Inc (CSU.TO) vs Berkshire Hathaway Inc (BRK.A) over the last 10 years. Share Price CSU.TO – … Read More
What A Difference 12 Months Makes @ycharts
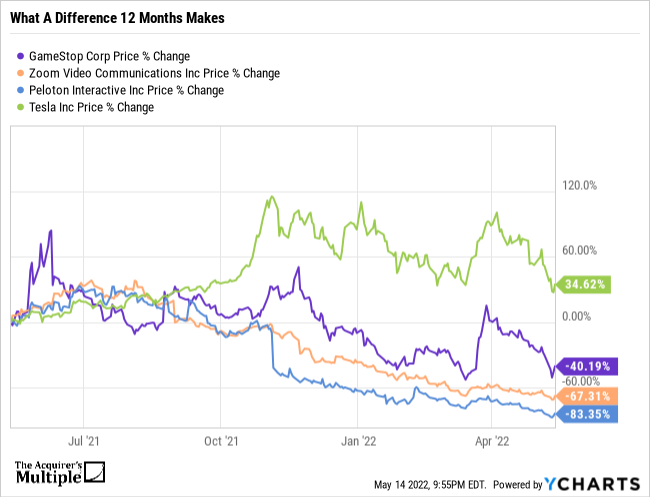
Here’s a list of some of the most popular names just 12 months ago. What a difference 12 months makes. Peloton Interactive Inc (PTON) – Down 83.35% Zoom Video Communications Inc (ZM) – Down 67.31% GameStop Corp (GME) – Down 40.19% Telsa Inc (TSLA) – Down 34.62% GME data by … Read More
Chart Of The Week: Biggest Losers – S&P 500 – YTD @ycharts
As part of a new weekly feature here at the Acquirer’s Multiple we’ll be providing some of our favorite charts of the week from @ycharts. This week we’ll take a look at the biggest losers YTD in the S&P 500. Netflix – down 71.09% Paypal Holdings Inc – 60.57 Align … Read More

