
Chart 1. Large Cap Returns 2015 Q1

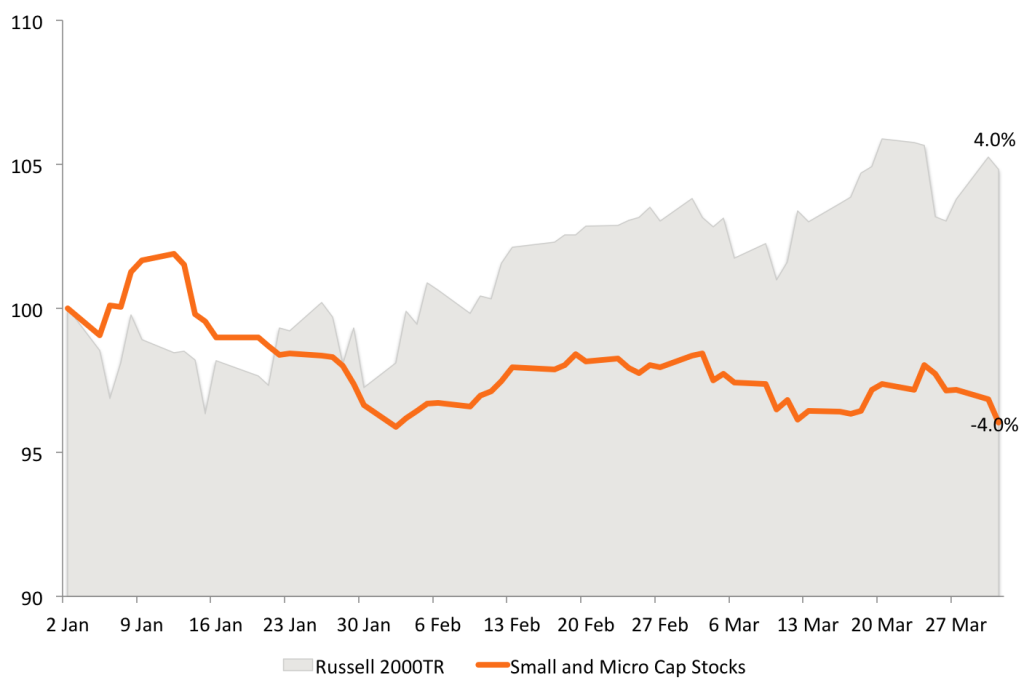
The Acquirer’s Multiple screeners had a mixed start to the first quarter of 2015. The Large Cap and All Investable screeners massively outperformed– the Large Cap screener was up 9.1 percent vs 1.6 percent for the Russell 1000 TR benchmark, and the All Investable up 6.9 percent vs 1.9 percent for the Russell 3000 TR benchmark–while the Small and Micro Cap Screener underperformed, down -4 percent versus up 4 percent for the Russell 2000 TR benchmark.
Chart 2. All Investable Returns 2015 Q1
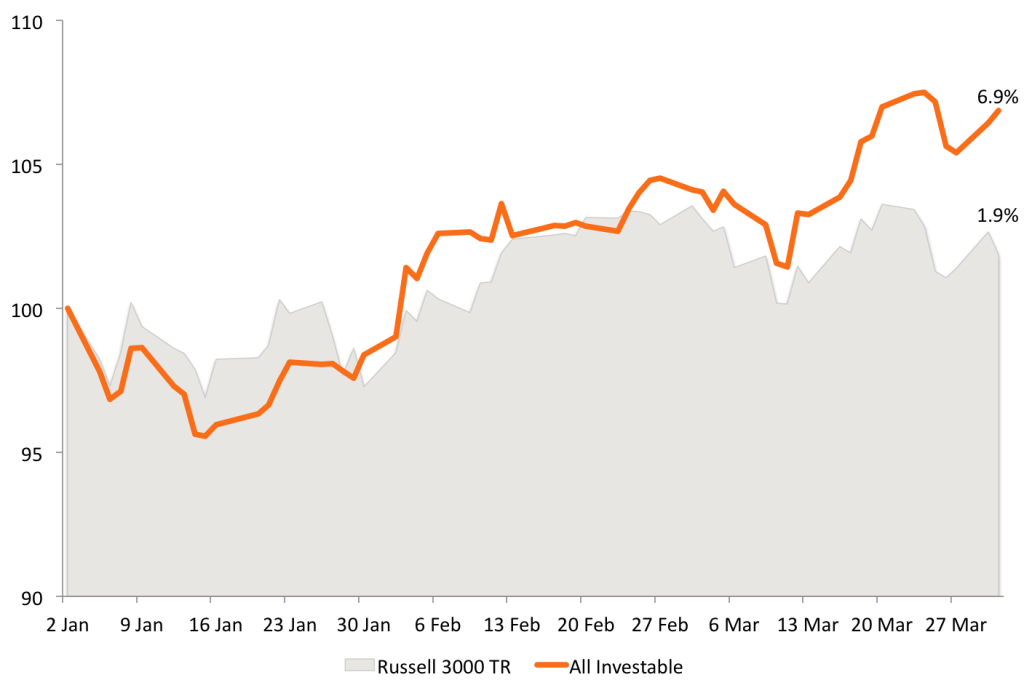
Chart 3. Small and Micro Cap Returns 2015 Q1
The big gainers for the Large Cap portfolio were Exelis Inc. (XLS) +40.9 percent, LyondellBasell Industries NV (LYB) +31.1 percent, and Anthem Inc. (ANTM) +29.4 percent. The big losers for the Large Cap portfolio were Alliance Resource Partners LP (ARLP) -22.4 percent, National Oilwell Varco Inc (NOV) -21.5 percent, and Copa Holdings SA (CPA) -10.2 percent.
Table 1. Large Cap Individual Portfolio Holding Returns 2015 Q1
| Ticker | Name | Starting Price | Ending Price | Return |
| VLO | Valero Energy Corp | $49.07 | $59.91 | 22.1% |
| ANTM | Anthem Inc | $125.53 | $162.43 | 29.4% |
| TEO | Telecom Argentina Stet-France SA, Buenos Aires | $18.73 | $20.88 | 11.5% |
| CNCO | Cencosud SA | $7.30 | $8.04 | 10.2% |
| YPF | Ypf Sociedad Anonima Yacimientos Petroliferos Fiscales | $26.22 | $29.60 | 12.9% |
| WNR | Western Refining Inc | $37.47 | $45.82 | 22.3% |
| TOT | Total | $50.26 | $52.66 | 4.8% |
| FLR | Fluor Corp | $60.27 | $58.78 | -2.5% |
| MAN | ManpowerGroup | $67.76 | $86.46 | 27.6% |
| ARLP | Alliance Resource Partners LP | $41.59 | $32.26 | -22.4% |
| BWC | Babcock & Wilcox Co (The) | $29.87 | $33.40 | 11.8% |
| NOV | National Oilwell Varco Inc | $64.74 | $50.81 | -21.5% |
| LYB | LyondellBasell Industries NV | $79.32 | $104.00 | 31.1% |
| WLK | Westlake Chemical Corp | $61.43 | $69.87 | 13.7% |
| XLS | Exelis Inc | $17.45 | $24.58 | 40.9% |
| HUM | Humana Inc. | $143.72 | $176.28 | 22.7% |
| HFC | HollyFrontier Corp | $37.65 | $43.09 | 14.5% |
| MEOH | Methanex Corp | $45.56 | $58.40 | 28.2% |
| CPA | Copa Holdings SA | $102.71 | $92.22 | -10.2% |
| AET | Aetna Inc. | $88.55 | $113.02 | 27.6% |
| T | AT&T Inc | $32.88 | $34.64 | 5.3% |
| MPC | Marathon Petroleum Corp | $89.83 | $103.46 | 15.2% |
| LEA | Lear Corp | $97.62 | $115.08 | 17.9% |
| EMN | Eastman Chemical Co | $75.72 | $77.89 | 2.9% |
| KOS | Kosmos Energy Ltd | $8.42 | $9.23 | 9.6% |
| CI | Cigna Corp | $103.28 | $132.72 | 28.5% |
| TSO | Tesoro Corp | $74.45 | $91.76 | 23.3% |
| ALK | Alaska Air Group Inc. | $59.97 | $67.06 | 11.8% |
| GT | Goodyear Tire & Rubber Co | $28.15 | $31.23 | 11.0% |
| OSK | Oshkosh Corp | $47.98 | $54.25 | 13.1% |
The big gainers for the All Investable portfolio were Alon USA Partners LP (ALDW) +73.0 percent, Petrobras Argentina SA (PZE) +50.2 percent, and Delek US Holdings Inc. (DK) +37.5 percent. The big losers for the All Investable portfolio were MagnaChip Semiconductor Corp (MX) -51.3 percent, Hugoton Royalty Trust (HGT) -39.2 percent, and Alliance Resource Partners LP (ARLP) -22.4 percent.
Subscribe to see the portfolio holdings of the All Investable and Small and Micro Cap Screener.
Click here to see the individual backtests for each of the Large Cap 1000, the All Investable, and Small and Micro Cap screeners.
Click here to see the underlying backtest data for each screen.
![]()
This content is restricted to registered paid users who are logged in. Click here to register or log in.
Disclaimer: Hypothetical performance does not represent actual performance and should not be interpreted as an indication of such performance. Actual performance may be materially lower than that of the hypothetical portfolios. Hypothetical performance results have certain inherent limitations. Such results do not represent the impact that material economic and market factors might have on an investor’s decision-making process if the investor was actually managing money. Hypothetical performance also differs from actual performance because it is achieved through the retroactive application of model portfolios (in this case, The Acquirer’s Multiple®) designed with the benefit of hindsight. As a result, the models theoretically may be changed from time to time and the effect on performance results could be either favorable or unfavorable.
For all the latest news and podcasts, join our free newsletter here.
Don’t forget to check out our FREE Large Cap 1000 – Stock Screener, here at The Acquirer’s Multiple:
