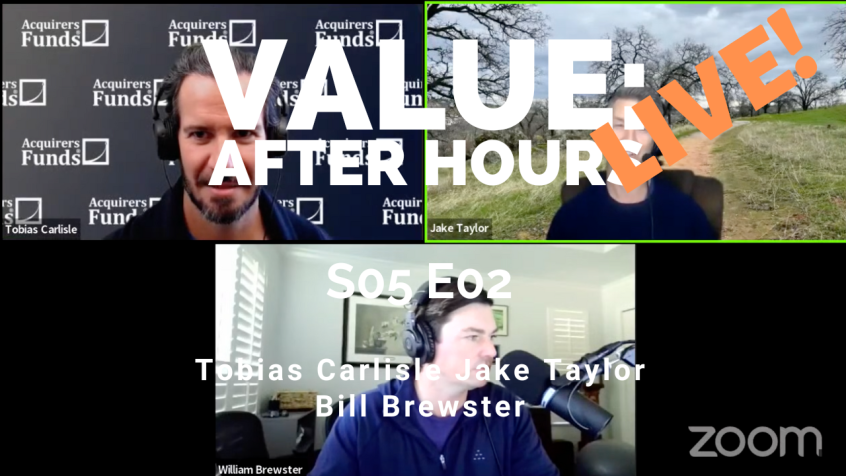
In their latest episode of the VALUE: After Hours Podcast, Brewster, Taylor, and Carlisle discuss 60% Forward Returns For Value. Here’s an excerpt from the episode:
Tobias: I just went through it. There’s a few sites to look at. AQR, Cliff had a post dated 31 December. They have market neutral, country neutral– sorry, industry-neutral, country-neutral assessments. They say, value in the 94th percentile as at the last time they looked, which is extraordinary given what’s happened since February 2021, everything collapsing. Still stayed that wide.
Jake: Yeah.
Tobias: Alpha Architect has it through to October 31 says EV/EBIT, which is my preferred metric, there’s only two dots that are wider than that and that’s the preceding dot and the one in June last year. So, we’ve only just started to close there. Greenblatt has a nice little thing on his site. If you just go through it, I think it’s gothamcapital.com. Front page of it.
Jake: Just gotham.com. Yeah.
Tobias: gotham.com
Jake: It’s currently 90th percentile towards cheap of his dataset.
Tobias: Yeah, it’s amazing. What was the yield across the portfolio? It is 13% EBIT on EV.
Jake: Yeah, something like that. That’s a really interesting site to poke around on and just look at different datapoints, different months that he’s captured, and just to see what was his universe of cheapness looking like relative to other periods and then what did it go on to do two-year forward returns from there. It’s like this trip down memory lane of going through– You looking at the late 90s, looking at– [crosstalk]
Tobias: Does he have late 90s data in there?
Jake: Yeah.
Tobias: Okay.
Jake: We can solve all the way back to ’94, if I remember right.
Tobias: Okay.
Jake: Yeah, just poking around there these little floating data points to see like what does it show is actually a fun exercise. I’m not going to tell you how long I spent messing around with that. [laughs]
Tobias: So, two-year forward return. Yeah. I didn’t realize that he’d gone back as far as that. I didn’t see that. Hang on, I’m just trying to find the time period. 30-year research history. Okay, so that’s longish.
Jake: He’s putting up there a very Cathie-like number of saying based on their historical data set, when you bend in the 90th percentile like we are today, the forward return was, he’s saying like 58% positive, which is quite a bit. Maybe that’s not quite– [crosstalk]
Tobias: I think two-year forward return is 58.87.
Jake: Yeah. That’s a half Cathie. [crosstalk]
Tobias: To be fair, there’s plenty of dots below that line.
Jake: Yeah, grain of salt there.
Tobias: He puts a red best fit line through that scatterplot. There’s plenty of dots below that. There’s also plenty of dots above that. I don’t know. Do you want to have a guess? Do you want to have a prediction? Above or below?
Jake: Oh, boy.
Bill: Mm. That’s interesting.
Jake: Two years from now, I’ll probably take the under.
Tobias: Yeah, that seems aggressive, doesn’t it? 60%. What’s that like, 25 compound? Gee, that’d be good, but that seems high to me. Maybe in small and micro. Small and micro, I think, is super, super cheap. Actually, there are two takes in that. I think on a relative basis, it’s super cheap. I don’t know how. Do you want to discuss, Jake, the small cap manager? Are you allowed to say his name? Are we allowed to–?
Jake: Eric Cinnamond?
Tobias: Yeah.
Jake: Yeah, sure. What? No, we’re not– [laughs]
Tobias: Let’s call him Eric C. No, we’re going to do this. E Cinnamond.
Jake: Yeah. Eric C from Florida. His counterargument to that spread and how cheap things are is that there’s just such a sugar high in the numbers from 2020 and 2021, especially from-
Tobias: Oh, yeah.
Jake: -COVID stimmy and all kinds of just craziness that’s happened, that the reversion to the mean is so likely in a lot of those numbers that they’re overstating the value that’s there. Therefore, if it comes back to Earth, you’re pretty far overexpensive compared to what reality would probably look like. So, that’s his counterargument to the, “God, the spreads are super cheap right now.”
Bill: Well, the number one holding that Gotham 1000 value has is Valero. Valero has printed on average, just eyeballing it from 2010 to– I don’t know, call it 2020, I don’t think any big refineries were built over that time. Maybe $3 billion and its TTM cash flow is $9 billion?
Jake: Yeah.
Tobias: [laughs]
Jake: Oh, it’s a daddy. [laughs]
Bill: Its market cap is $52 billion versus an average market cap of what looks like $34-ish billion. You’ve got CF industries in there, you got Suncor. Look, if we’re in a commodity super cycle, this thing works. And if not, it’ll be something that screams cheap based on overearning cyclicals, which would not be the first time.
Jake: Yeah. Isn’t that always the case though for all these things, is it’s like, “God, this thing is over earning. Therefore, you got to fade it.” Then, the few that maintain that business momentum carry the portfolio?
You can find out more about the VALUE: After Hours Podcast here – VALUE: After Hours Podcast. You can also listen to the podcast on your favorite podcast platforms here:
For all the latest news and podcasts, join our free newsletter here.
Don’t forget to check out our FREE Large Cap 1000 – Stock Screener, here at The Acquirer’s Multiple:


