
In their latest Q4 2021 Quarterly Review, Horizon Kinetics provide some great illustrations of how the markets might distract, or harm (or help) investors. Here’s an excerpt from the review:
This section was prompted by a professional-investor client, who suggested an update on the concentration in the S&P 500. It’s an apt request, since the theme of this 4th Quarter Review is looking at where we’ve come from, to help us know where we’re going. Focusing on the noise of the ‘news’ strips away all perspective.
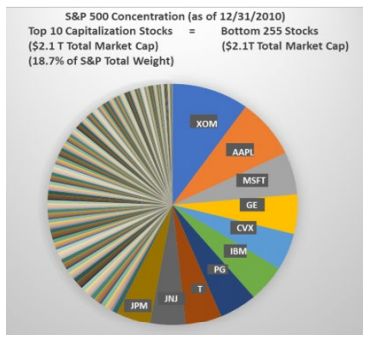
In this chart of the S&P 500 in Dec. 2010, the top 10 companies had the same aggregate market value as the bottom 255 stocks. They were 18.7% of the index value.
Today’s S&P 500: the top 10 have the same market value as the bottom 408. They’re now 30.5% of the market.
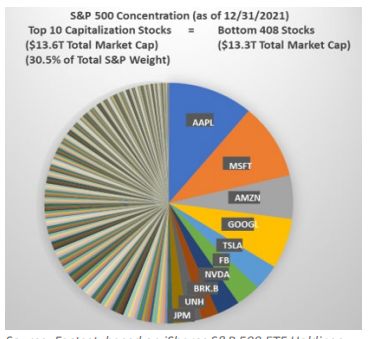
In 2010, the top 10 included two oil companies, an industrial company, a consumer products company, a drug company, telecommunications company, and a bank. Plus 3 technology companies. Today, 7 of the top 10 are IT companies. There’s still a bank, but no oil companies. Those are the concentrations.
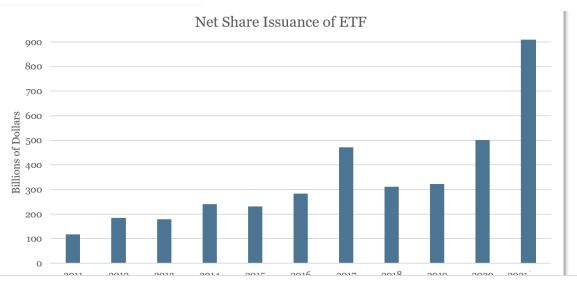
All of that happened in the last decade, the power growthphase of the ETF industry. What does ‘power’ mean here? It means an overwhelming weight of money, of inflows into the same index-centric stocks:
From $100 billion of net inflows into ETFs in 2011 to a record $500 billion in 2020, which about doubled to $900 billion last year. Net new money just in December, at $99 billion, was almost equal to the entire year of 2011.
The obvious implication is that one is exposed to a single-industry/systemic risk concentration. One that is overvalued. It’s no mystery how every previous such concentration ended, whether Energy in 1980, Technology/Telecom in 1999, or Financials in 2006. This holds for most large-cap indexes, even if not the S&P 500.
Before we get to the other two implications of today’s market concentration, let’s pause and think about how well the market has done since the age of ETF investing started. It’s a good time to do this, because we now have 20 years of history, one more element of the one- and two-generation cycle we’ve been in.
Since iShares rolled out its first series of ETFs in mid-2000, there is now a 20-year track record. We’ll ask the question: how well have the various major indexes done? Before we start, just for orientation, a recap of how constructive and ebullient this era has been for the stock market.
• It included a record 10-year-plus bull market, from March 2009 to Jan 2020. And if you decide it’s ok not to count the 10-month pandemic drop – because the S&P was actually up 18% in 2020 – then it has been a 12 ¾ -year bull market.
• The S&P 500 set a record number of new all-time highs in 2021: 70 of them.
• The rise of the mega-cap companies.
• The rise of the Information Technology and Social Media companies, which are the most profitable, margin-wise as well as in pure dollar volume, large companies in history.
• The decline in the 10-year Treasury rate from 6% in mid-2020 to 1.5% at year-end 2021. That was beneficent not just for valuation-multiple expansion, it contributed to expanding net profit margins as companies continually re-financed their higher-cost debt.
• Think of the tremendous share repurchase activity amongst the larger companies.
• Think of the manufacturing efficiencies, vanguarded by Apple’s global supply chain development, and by the work place efficiencies enabled by the information technology companies, data processing apps and cloud services.
• Think of the decade, give or take, of declining commodity costs.
• Which helps to explain the record high net profit margins among the S&P 500 companies.
So, how have the indexes done? Surprising?
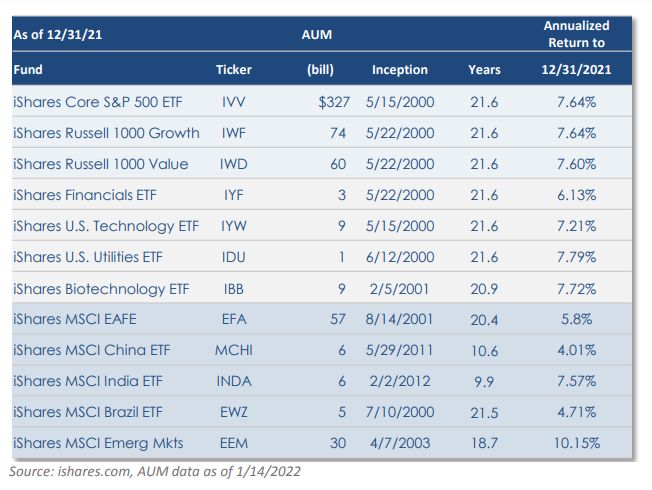
The real issue is not that they’ve done so poorly. It’s the question: if this is the result after 20 years of all that support, how will the indexes do in a harsh environment?
You can read the entire review here:
Horizon Kinetics Q4 2021 Quarterly Review
For all the latest news and podcasts, join our free newsletter here.
Don’t forget to check out our FREE Large Cap 1000 – Stock Screener, here at The Acquirer’s Multiple:
