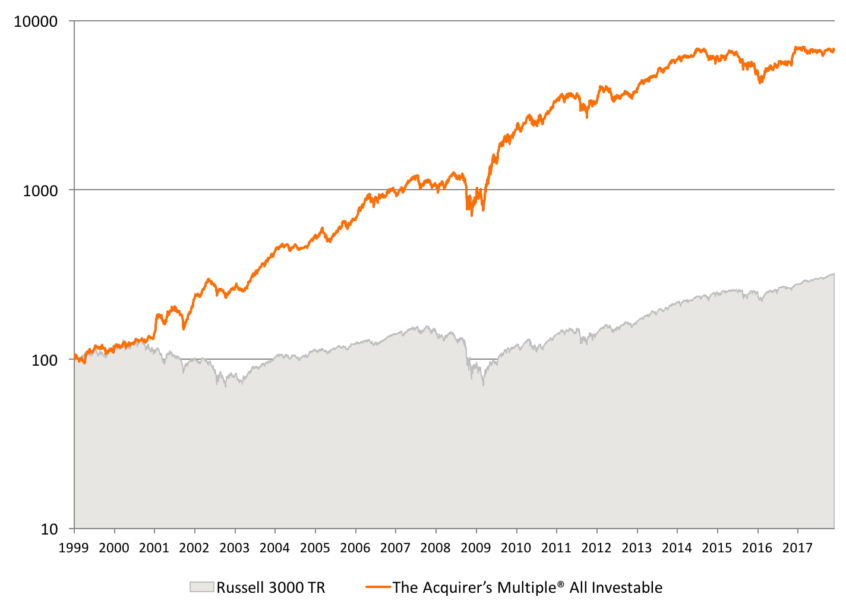
We’ve just completed the updates to our backtest results for all of our Acquirer’s Multiple screens. Following is a summary of the results for our three major U.S. Stock Screens – The Large Cap, The All Investable, and The Small & Micro-Cap Screen.
Since the last update in July 26, 2016, the screens have had mixed performance.
The Large Cap Screen
The Large Cap Screen had a strong finish to end the 2016 year up 27.4 percent, handily beating out the Russell 1000’s 15.1 percent by 12.3 percent. 2017 to date has seen continued strength in the Large Cap Screener. For the year, the Large Cap Screen’s 18.8 percent has outperformed the Russell 1000’s 16.9 percent by 1.9 percent. You can view the backtest results here.
The All Investable Screen
The All Investable Screen also had a strong finish to end the 2016 year up 29.1 percent, handily beating out the Russell 3000’s 12.2 percent by 16.9 percent. Unfortunately, 2017 to date has been a disaster. For the year, the All Investable Screen has gone backwards, down -6.6 percent, underperforming the Russell 3000’s strong 16.3 percent by a shocking -22.4 percent. This is the worst relative performance the screen has seen in almost 20 years. You can view the backtest results here.
The Small & Micro Cap Screen
The Small and Micro Cap Screen also had a very strong finish to end the 2016 year up 35.5 percent, handily beating out the Russell 3000’s 12.2 percent by 20.4 percent. 2017 to date has been weaker. For the year, the Small and Micro Screen gained 12.0 percent, underperforming the Russell 3000’s strong 16.9 percent by a -4.9 percent. You can view the backtest results here.
For all the latest news and podcasts, join our free newsletter here.
Don’t forget to check out our FREE Large Cap 1000 – Stock Screener, here at The Acquirer’s Multiple:


2 Comments on “Acquirer’s Multiple Screens – Updated Backtest Results – November 2017”
How have the acquirers multiple results been up to now in December of 2018 for all three screens?
I’m keen to see these results also.