
I’ve just been re-reading one of my favorite investing books of all time, The Dhando Investor, written by Mohnish Pabrai. In Chapter 7, Dhandho 102: Invest in Simple Businesses, Pabrai provides a very simple example of how to calculate intrinsic value using the real life example of Bed Bath & Beyond Inc (NASDAQ:BBBY).
It’s a great illustration of how intrinsic value is not an exact figure but a range that you can compare to the company’s current market value to determine whether you want to dig further into the company.
Here’s an excerpt from The Dhando Investor:
When we see a huge gap between the price and intrinsic value of a given business—and that gap is in our favor—we can act and buy that business. Let’s take the example of a well-known retail business, Bed Bath and Beyond (BBBY).
I have to admit that I have never analyzed BBBY before. I have been to its stores a few times over the years, and it has been a pleasant experience. As I write this, BBBY has a quoted stock price of $36 per share and a market cap of $10.7 billion. We know BBBY is being offered on sale for $10.7 billion. What is BBBY’s intrinsic value?
Let’s take a look at a few BBBY statistics on Yahoo Finance.
BBBY had $505 million in net income for the year ended February 28, 2005. Capital expenditures for the year were $191 million and depreciation was $99 million. The “back of the envelope” net free cash flow was about $408 million.
It looks like BBBY is growing revenues 15 percent to 20 percent and net income by 25 percent to 30 percent a year. It also looks like it stepped up capital expenditure (capex) spending in 2005. Let’s assume that free cash flow grows by 30 percent a year for the next three years; then grows 15 percent a year for the following three years, and then 10 percent a year thereafter. Further, let’s assume that the business is sold at the end of that year for 10 to 15 times free cash flow plus any excess capital in the business. BBBY has about $850 million in cash in the business presently (see
Table 7.3).
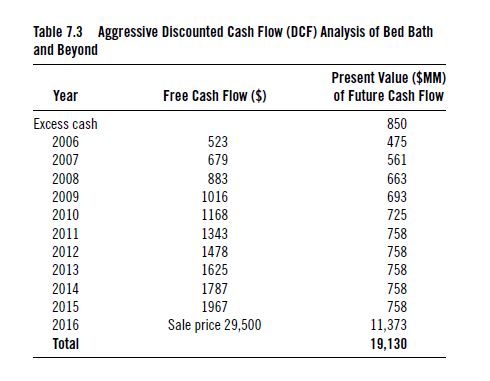
So, the intrinsic value of BBBY is about $19 billion, and it can be bought at $10.7 billion. I’d say that’s a pretty good deal, but look at my assumptions—they appear to be pretty aggressive. I’m assuming no hiccups in its execution, no change in consumer behavior, and the ability to grow revenues and cash flows pretty dramatically over the years. What if we made some more conservative assumptions? We can run the numbers with any assumptions.
The company has not yet released numbers for the year ended February 28, 2006, but we do have nine months of data (through November 2005). We can compare November 2005 data to November 2004 data. Nine month revenues increased from $3.7 billion to $4.1 billion from November 2004 to November 2005. And earnings increased from $324 million to $375 million.
It looks like the top line is growing at only 10 percent annually and the bottom line by about 15 percent to 16 percent. If we assume that the bottom line growth rate declines by 1 percent a year—going from 15 percent to 5 percent and its final sale price is 10 times 2015 free cash flow, the BBBY’s intrinsic value looks like Table 7.4. Now we end up with an intrinsic value of $9.6 billion.
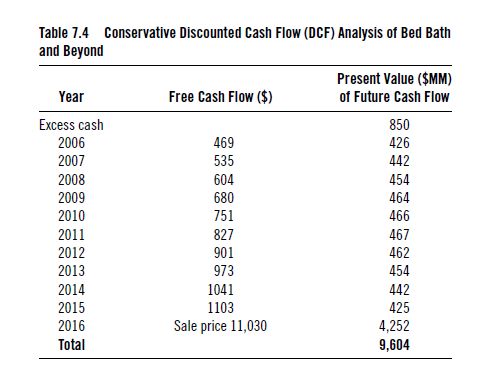
BBBY’s current market cap is $10.7 billion. If we made the investment, we would end up with an annualized return of a little under 10 percent. If we have good low-risk alternatives where we can earn 10 percent, then BBBY does not look like a good investment at all.So what is BBBY’s real intrinsic value?
My best guess is that it lies somewhere between $8 to $18 billion. And in these calculations, I’ve assumed no dilution of stock via option grants, which might reduce intrinsic value further. With a present price tag of around $11 billion and an intrinsic value range of $8 to $18 billion, I’d not be especially enthused about this investment. There isn’t that much upside and a fairly decent chance of delivering under 10 percent a year.
For me, it’s an easy pass.
For all the latest news and podcasts, join our free newsletter here.
Don’t forget to check out our FREE Large Cap 1000 – Stock Screener, here at The Acquirer’s Multiple:

One Comment on “Mohnish Pabrai – How To Calculate Intrinsic Value”
Hey Hey
First of all i want to thank you for your great website.
I’ve got a two folded question regarding these calculations though.
First: Table 7.3
Net income = 505
Capex= 191
Depreciation = 99
=> 505 + 99 -191 = 413
not 408, right?
How do we get a FCF from 413 to 523 with a growth of FCF of 30%
My calculation comes at 536,9 ??
Same for table 7.4.
How do we get to 469???
thanks in advance