Updated November 29, 2017
Since the last update in July 26, 2016, the screens have had mixed performance.
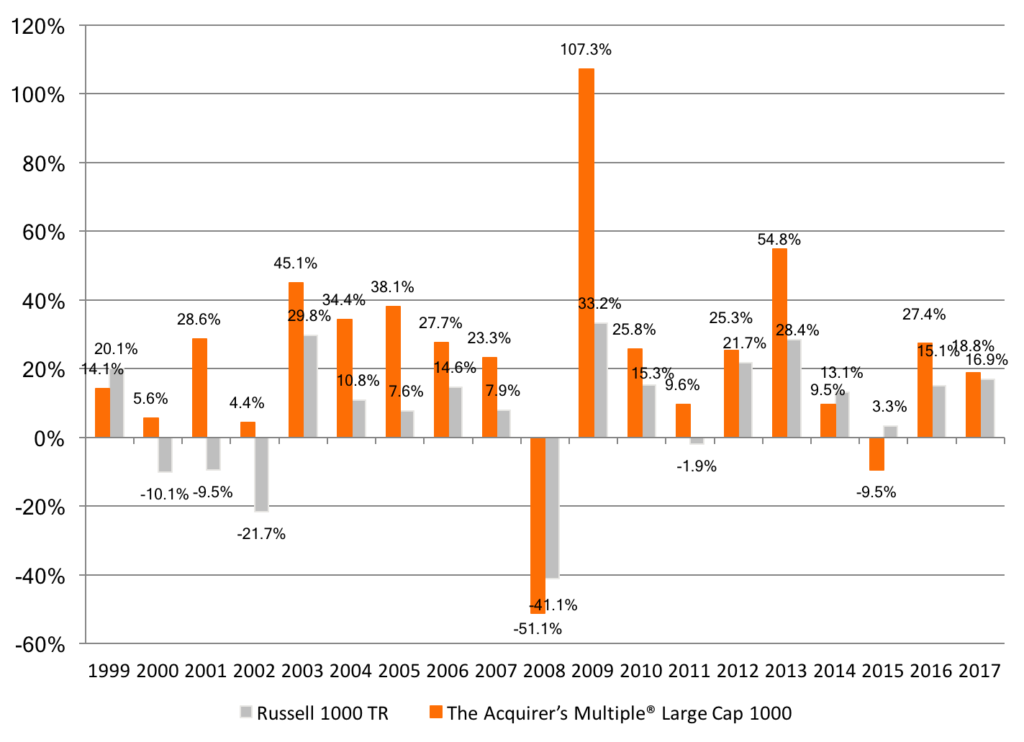
The Large Cap Screen had a strong finish to end the 2016 year up 27.4 percent, handily beating out the Russell 1000’s 15.1 percent by 12.3 percent. 2017 to date has seen continued strength in the Large Cap Screener. For the year, the Large Cap Screen’s 18.8 percent has outperformed the Russell 1000’s 16.9 percent by 1.9 percent.
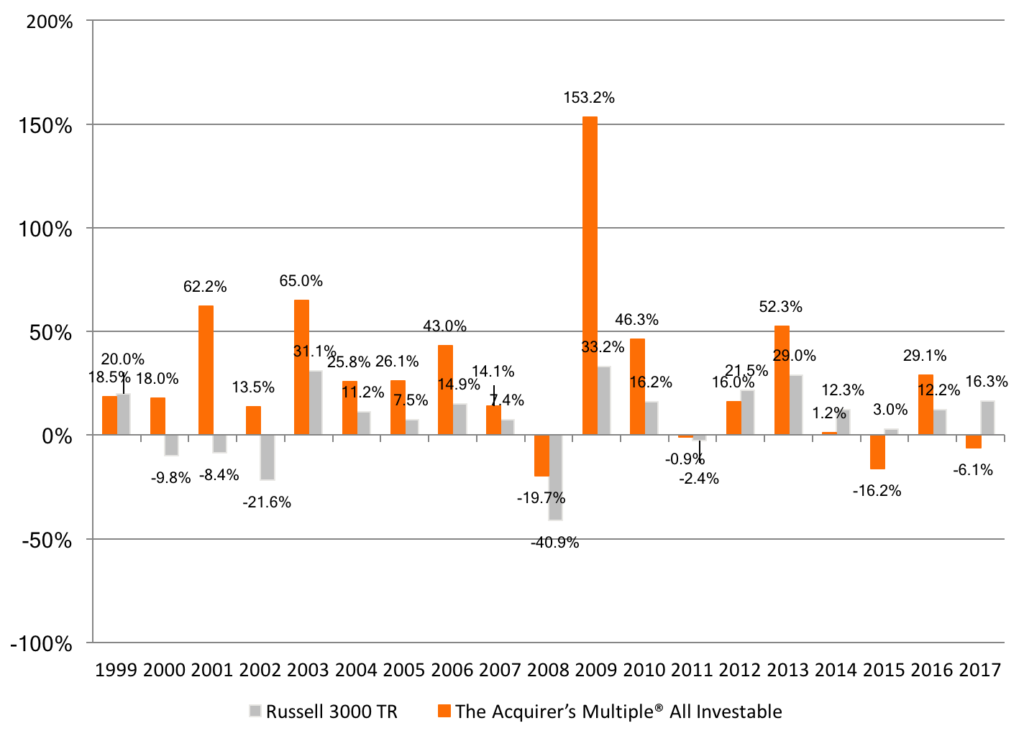
The All Investable Screen also had a strong finish to end the 2016 year up 29.1 percent, handily beating out the Russell 3000’s 12.2 percent by 16.9 percent. Unfortunately, 2017 to date has been a disaster. For the year, the All investable Screen has gone backwards, down -6.6 percent, underperforming the Russell 3000’s strong 16.3 percent by a shocking -22.4 percent. This is the worst relative performance the screen has seen in almost 20 years.
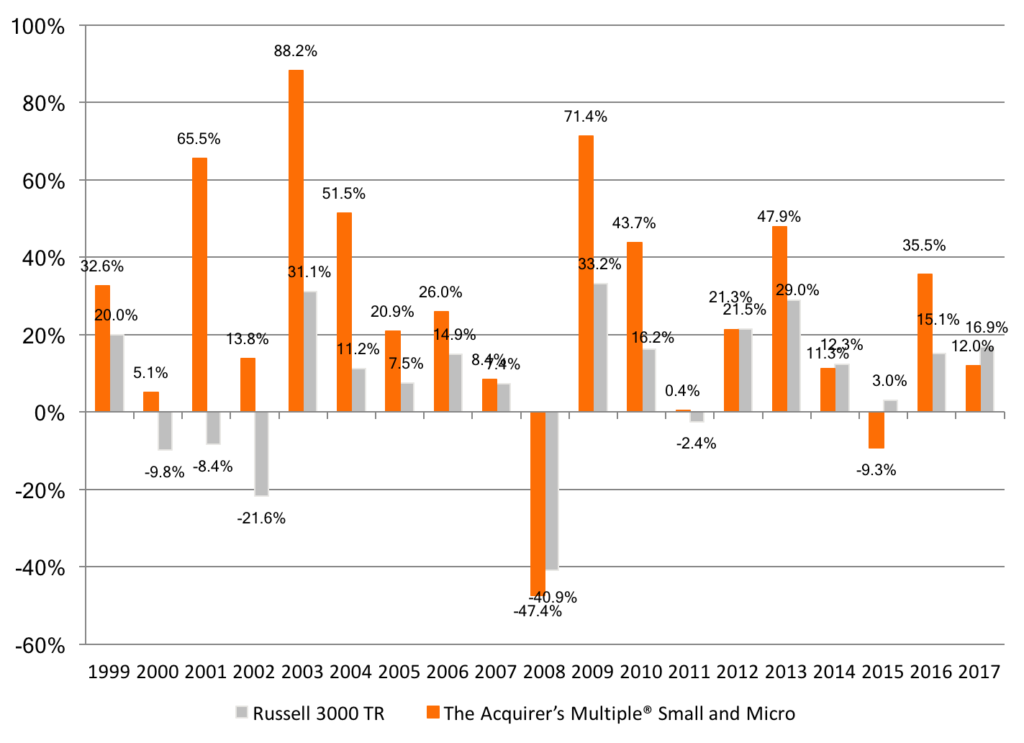
The Small and Micro Cap Screen also had a very strong finish to end the 2016 year up 35.5 percent, handily beating out the Russell 3000’s 12.2 percent by 20.4 percent. 2017 to date has been weaker. For the year, the Small and Micro Screen gained 12.0 percent, underperforming the Russell 3000’s strong 16.9 percent by a -4.9 percent.
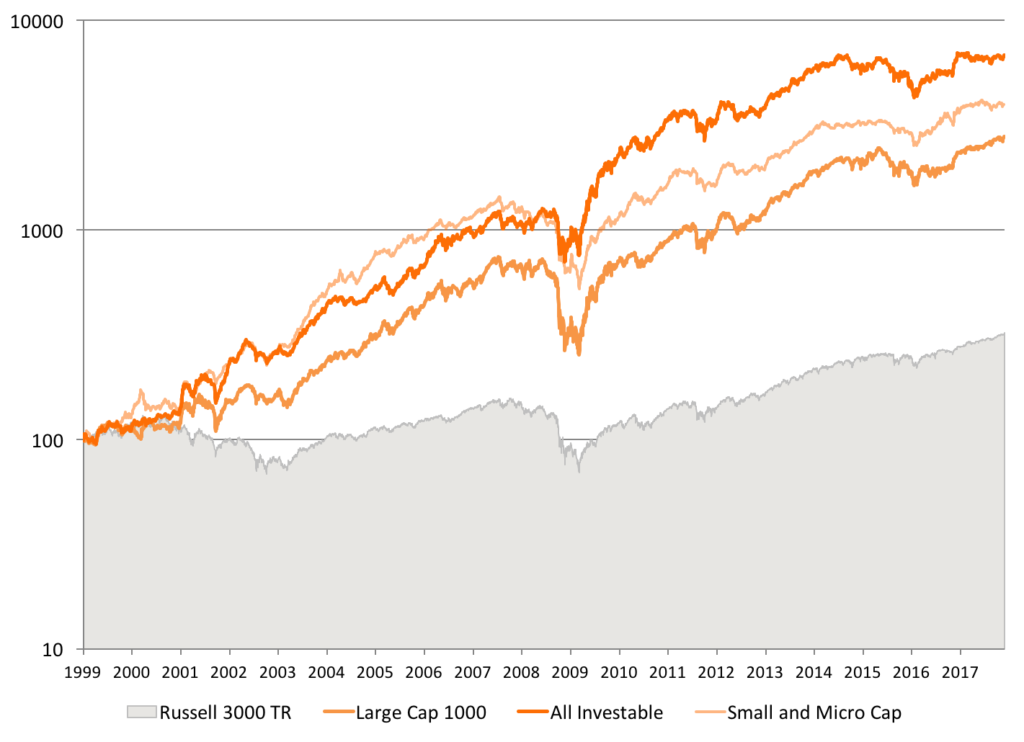
Chart 1. Returns from January 2, 1999 to Date (Log.)
We backtested the returns to a theoretical portfolio of stocks selected by The Acquirer’s Multiple® from each of the Large Cap 1000, All Investable and Small and Micro Cap stock screens.
The backtest assumed the model bought and held for a year 30 stocks selected from each of the universes (the Large Cap 1000 screen draws from the largest 1,000 stocks; the All Investable screen draws from the largest half of stocks by market capitalization; and the Small and Micro Cap screen draws from the smallest half by market capitalization–see the Guide to the Three Universes for more information).
Each screen was rebalanced on the first day of the year using the most recent fundamental data. The backtest ran from January 2, 1999 to date. We excluded utilities and financials, and stocks traded over-the-counter (OTC).
Over the full period, the All Investable screen generated the highest total return of 6,765 percent, or a CAGR of 25.0 percent per year. The Small and Micro Cap screen generated the second highest total return of 3,948 percent, or a compound growth rate (CAGR) of 21.5 percent per year. The Large Cap 1000 generated the lowest total return of 2,797 percent, or 19.3 percent per year compound.
All beat their respective benchmarks.
Yearly Returns from January 2, 1999 to Date
Chart 2.1 The Acquirer’s Multiple® Large Cap 1000
The Acquirer’s Multiple® Large Cap 1000 model portfolios have generally outperformed, although underperformed in 1999 (-6 percent), 2008 (-10 percent), 2014 (-3.6 percent), and 2015 (-12.8 percent).
Chart 2.2 The Acquirer’s Multiple® All Investable
The Acquirer’s Multiple® All Investable model portfolios have generally outperformed, although underperformed in 1999 (-1.6 percent), 2012 (-5.5 percent), 2014 (-11.1 percent), 2015 (-19.2 percent) and 2017 to date (-22.4 percent).
Chart 2.3 The Acquirer’s Multiple® Small and Micro
The Acquirer’s Multiple® Small and Micro model portfolios generally outperformed, although underperformed in 2008 (-6.5 percent), 2012 (-0.3 percent), 2014 (-1.0 percent), 2015 (-12.3 percent), and 2017 to date (-4.9 percent).
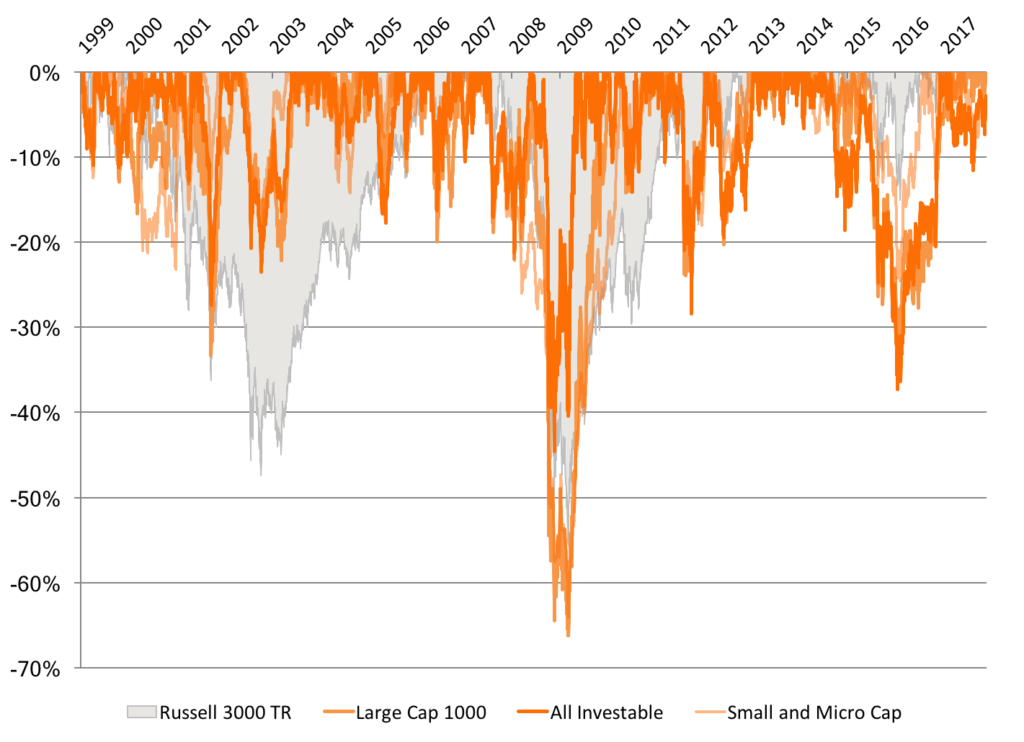
Chart 3. Drawdowns from January 2, 1999 to Date
The Large Cap 1000 Screen saw the largest drawdown of 66 percent, which occurred between July 2007 and March 2009. The worst drawdown for the All Investable screen was -45 percent, and -64 percent for the Small and Micro Cap .
The 30-stock screen selected by The Acquirer’s Multiple® from each of the Large Cap 1000, All Investable and Small and Micro Cap universes consistently outperformed the broader Russell 1000 TR, Russell 2000 TR and Russell 3000 TR. The trade off is periodic underperformance–approximately one in four years–and deeper and more frequent drawdowns.
3. Don’t Mess With the Screens – Human Intervention Hurts Your Performance.
Disclaimer: Backtested performance does not represent actual performance and should not be interpreted as an indication of such performance. Actual performance may be materially lower than that of the backtested screen. Backtested performance results have certain inherent limitations. Such results do not represent the impact that material economic and market factors might have on an investor’s decision-making process if the investor was actually managing money. Backtested performance also differs from actual performance because it is achieved through the retroactive application of model screen (in this case, The Acquirer’s Multiple®) designed with the benefit of hindsight. As a result, the models theoretically may be changed from time to time and the effect on performance results could be either favorable or unfavorable.
For all the latest news and podcasts, join our free newsletter here.
Don’t forget to check out our FREE Large Cap 1000 – Stock Screener, here at The Acquirer’s Multiple:


38 Comments on “2. Deep Value Investing Returns (Acquirer’s Multiple) – January 2, 1999 to November 29, 2017”
Hi Tobias,
A few questions:
1) Why are utilities and financials are left out of the screen?
2) How do the returns and drawdowns of the TAM portfolios (Large, All & Small) with 20-stocks compare to those of the 30-stock portfolios?
3) Taxes and trading costs will reduce the returns on the TAM portfolios presented here due to their annual re-balancing. In order to present a more “apples to apples” result against the buy-and-hold benchmark, it would be interesting to see the TAM results adjusted to reflect some estimates of the impact of taxes and trading fees. As a back-of-the-envelope calculation do you think it would be fair to take a 25% avg annl return (as generated by Small TAM) and reduce it by an estimate of tax (say 30% for this example) and an estimate of trading costs (spread + broker fee = 1% in this example) and get 25% – 7.5% – 1% = 16.5%?
4) Industry concentration–As of today roughly 40% of the stocks in the Large Cap TAM portfolio are in the energy sector. I suspect that this level of industry concentration is “normal” over time for TAM portfolios. And if that is true, I suspect that this contributes to their larger drawdowns compared to the benchmark. This raises the question: by limiting industry concentration in the TAM portfolios, can we reduce drawdowns while still maintaining returns? Likely you’ve already looked into this. I wonder what you found.
5) Joel Greenblatt has said that he had difficulty finding a database with reliable information to calculate the Magic Formula and ended up using the expensive Compustat database. Later when he set up Gotham Funds he felt that he needed to create his own database presumably because there were no publicly available databases which he felt were adequate. What can you tell us about the database you use for TAM and any concerns we should have about its reliability, look-ahead bias, etc..?
Thanks in advance for your time and thoughts on these questions.
Hi James,
Thank you for the questions.
1. We exclude utilities and financials because they have unusual financial statements that don’t readily fit an analysis using the acquirer’s multiple.
2. Concentrating generally increases returns. Reducing the portfolio size from 30 to 20 here increases returns in the Large Cap 1000 and All Investable universes, and slightly reduces them in the Small and Micro Cap universe. On a rolling basis the AAR for the Large Cap 1000 goes from 20.1 percent at 30 positions to 22.6 at 20; the All Investable goes from 26.3 percent at 30 positions to 26.9 at 20; the Small and Micro Cap goes from 25.8 percent at 30 positions to 25.5 at 20.
3. The results here are reduced by a 1 percent brokerage or management fee and allow 0.5 percent in slippage. After tax returns will vary from investor to investor and impact both the index fund and the acquirer’s multiple. A fully taxable investor should be holding for long-term capital gains at 15 percent and selling short-terms losers too. The results as they are presented are as close to an apples-to-apples comparison as possible.
4. Anything that makes the portfolios appear more like the index will make the portfolios perform more like the index. If the industry concentration is limited to the concentration in the index, the returns will look more like the index’s returns. Drawdowns tend to be about in line with the index. They were less in 2000-2 and equivalent in 2007-9, except for the Large Cap 1000, which drew down more.
5. There are two distinct issues here: Greenblatt was talking about cleaning up the database to use it as a screening tool, and you’re also asking about using it as a backtesting tool. He says that he has had his team conduct an individual valuation or each stock and trades them based on their discount to that valuation. We use Compustat, which is a commercially available database. It does occasionally contain errors and we correct them as we find them. There are many issues with databases as backtesting tools that we cover in great detail in Quantitative Value. Look-ahead bias is solved by a good database and lagging the data. Compustat’s point-in-time database is the industry standard. Additionally, we lag the data 6 months to make sure that any interim reports are in the data.
Hope that helps. Thank you for the great questions.
Hello Tobias,
Can be in the list of your the screeners company from China or US firm which operates only in China and has Chinise management and main owner? I just do not belive in Chinese corporate governance so your sceener will be worthless for me. Thank you
The screener eliminates Chinese domiciled companies.
Tobias,
Have you screened based on these criteria in other markets and are the results similar? And if not does that suggest that going forward the results might underperform (or randomly perform)?
As I outline in Deep Value, the results are broadly similar for value investing in developed markets, not to three decimal points, but in the same direction (i.e. value outperforms, and the acquirer’s multiple beats the Magic Formula). More here (about halfway down).
Great Article!
Hello Tobias. Sorry if this is on the site and I missed it, but I see the results are based on backtesting. At what point did you start entering real trades off this? For better or worse at least some people are skeptical of backtesting for “curve fitting” type analysis where screens can be developed to fit a curve and the past. Please do not take this as being rude, I am just trying to learn.
Thank you.
Hi Tobias,
Are the 30 stocks for each portfolio chosen at random from the screen results?
Eric
No. Top 30 positions in each.
Thanks. Do the stocks in your screen need to have positive operating earnings to be included?
Yes they do.
Tobias,
I’m considering signing up for your All Investable and Small Cap screeners. Do you exclude stocks that don’t meet the -2.22 Beneish M-Score as well as the companies that are at high risk for bankruptcy based on the formula in the paper “In Search of Distress Risk” you mentioned in your book?
Thanks,
Juan
Not quite. It excludes the worst 5 percent based on a combination of those risk factors, which is the way it works in the book.
Hi Tobias,
I am curious to know why the yearly return chart on this page shows All Investable returned 58% in year 1999. However, when I see the individual backtest of All Investable, the yearly return chart there shows All Investable returned 17% in year 1999. Russell 3000 TR returned 20% as shown in both yearly return chart. This is the case for all yearly returns of All Investable.
1. Can you please provide the reason for difference in return of All Investable between the two charts?
2. Also, what were the returns of all screeners for year 2015? If you can update the charts with 2015 results, it would be great.
Thanks a lot,
Hiren
Hi Hiren,
1. The short answer is I messed up the comparison chart trying to combine three together. The individual chart is the correct one at 18.5 percent (slight difference is due to the start date moving back a week).
2. Up now.
Tobias
Hi Tobias,
Thank you for taking time to quickly reply to my questions and updating the charts. It is interesting that since 2011 Large Cap screener has outperformed both Small/Micro Cap and All Investable. However, All Investable has the best record since inception.
How much of an effect does start date has on the performance of the screener? If someone were to start on, let’s say March 1 of every year or any other date, would the performance be significantly different over the long period of say 5 to 10 years? It is likely that you have already looked into this and I would really appreciate if you can share your insights.
Regards,
Hiren
There is a very small January effect but it’s not much more than randomness. You’re generally better starting earlier than waiting for the “right” start date.
Pingback: 1. We hand-pick the 90 Best Deep Value Stock Picks | Deep Value Stock Screener - The Acquirer's Multiple®
Pingback: Unlimited Free Access to Our Large Cap 1000 - Deep Value Stock Screener | Stock Screener - The Acquirer's Multiple®
Pingback: How do we hand-pick the 90 best Deep Value Stocks for our Screens | Stock Screener - The Acquirer's Multiple®
Hi Tobias,
First of all, I am a great admirer of your work. Having read all of your books and a number of blog posts on green-backed, listening to you on TIP podcast and recently on Patrick O’shaughnessy’s podcast.
A question about strategy:
What are your thoughts on the possibility of introducing a stop loss in the strategy? can it be useful in limiting draw-downs? Or it may end up stopping out future possible winners?
Thanks. Shahrukh
Hi Shahrukh, Thanks for the kind words. I have tested the stop loss and don’t like it or use it because it reduces returns. Winners tend to move around too much.
Hi Tobias,
Your research is very compelling! Thanks for sharing your findings with us. Regarding the back testing, are you saying you took the 30 stocks from the given screener and bought ALL 30 stocks on the same day (say January 1st) and held them ALL until January 2nd of the next year and sold all positions that were not in the new screener? Did you buy equal dollar amounts of each stock at the beginning? At each anniversary, did you rebalance ALL stocks back to equal dollar amounts?
Thanks in advance for the clarification.
Hi Tobias,
Before I sign up for a paid subscription are there any current updates you can share.
Need to update the page but the 2017 results were as follows:
* Large Cap +20.9%
* All Investable +6.3%
* Small and Micro +9.4%
Hi Tobias,
I just finished reading TAM, great book! Have you considered using or have you used/tested TAM with options, particularly LEAPs, due to the longer duration of the holdings? Or, is the time decay too much of a drag on the overall performance?
Additionally, to the point of using stop-losses, have you considered or tested using Put Options as a hedge, in lieu of placing stops?
Thanks,
Brian
Thanks for the kind words, Brian! I use LEAPs where appropriate (low vol, or big downside). I haven’t tested the use of puts. It’s an interesting idea. My sense is you’d lose a lot of return paying for all that vol.
Hi Tobias,
Have I understood the screener correctly whereby you only buy and sell once per year? Or can you average down on dips?
Also, any chance we can screen in Australia? The brokerage fees are insane buying US equities here, and we don’t have a robin hood equivalent in the land down under…
Cheers,
Jesse
Once a year is enough, but there’s nothing stopping you averaging down–just stay within your risk limits. Long-term plan for Australia, but nothing immediate.
Hi Tobias and Johnny,
Are you going to update the performance numbers of the screeners to include 2018? If so, when do you plan to do that?
Thanks,
Brian
Please see prior comment/question from January 14, 2019.
Thank you.
Brian
I am also curious as Brian is regarding the performance of the screener for 2018. Keep up the good work!
Thanks
Eddie
Hi Tobias,
I read the new acquirers multiple book and was a little confused on rebalancing. It seemed in the book that you were suggesting looking at the screener at least quarterly to remove any losers that are no longer in the screen. I had thought you had also suggested doing a once a year rebalance. Does either method work but you were suggesting that the latter is preferable for a taxable account?
Either is fine. Some folks want to spend more time on it, so do it quarterly, but no more often.
Hi Tobias,
Great work and content. I learnt so much from the free resources on this page.
What market market cap cut-offs do you use to define Small/micro cap and all-investable?
Thanks,
MM
Thanks MM.
https://acquirersmultiple.com/2016/06/a-guide-to-the-three-stock-universes-large-cap-1000-all-investable-and-small-and-micro-cap/
“The Large Cap 1000 screener is drawn from a universe comparable to the Russell 1000. We define the universe as the largest 20 percent of listed companies. This means that the Large Cap 1000 draws the 30 best stocks from a universe of the largest 1,046 stocks. As at January 1, 2015, the smallest of stock in the Large Cap 1000 had a market cap of $2,940 million.
The All Investable screener is drawn from a universe comparable to the Russell 3000. We define the universe as the largest half of all listed companies. It includes stocks in the Large Cap 1000 universe. As at January 1, 2015, it contained 2,954 stocks with a median market capitalization of $1.43 billion, the smallest of which had a market cap of $131 million. This universe gives the best balance of returns and ease of investability.
The Small and Micro Cap screener is drawn from the universe of stocks that fall outside the All Investable universe. We define the universe as the smallest half of all listed companies. This means that the Small and Micro Cap screener draws the 30 best stocks from a universe of the smallest 846 stocks. As at January 1, 2015, the largest company in the universe had a market capitalization of $131 million, and the smallest of which had a market cap of $0.9 million.”
Hi Tobias
Time to update the performance data?
Regards
Geoff