

As part of a new series, each week we typically conduct a DCF on one of the companies in our screens. This week we thought we’d take a look at one of the stocks that is not currently in our screens, Meta Platforms Inc. (META).
Profile
Meta Platforms Inc. is a multinational technology conglomerate focused on social media, virtual reality, and digital advertising. The company operates through multiple key segments:
- Family of Apps (FoA): Includes core businesses such as Facebook, Instagram, Messenger, and WhatsApp.
- Reality Labs: Focuses on virtual reality (VR), augmented reality (AR), and the development of the metaverse.
- Advertising & Commerce: Generates the majority of revenue through digital advertising across its platforms.
Meta continues to expand its AI-driven advertising, content recommendation systems, and virtual/augmented reality ecosystem to drive engagement and monetization.
Recent Performance
Over the past twelve months, Meta’s share price has increased by 23.97%, reflecting strong growth in digital advertising, AI adoption, and strategic investments in the metaverse and reality labs.
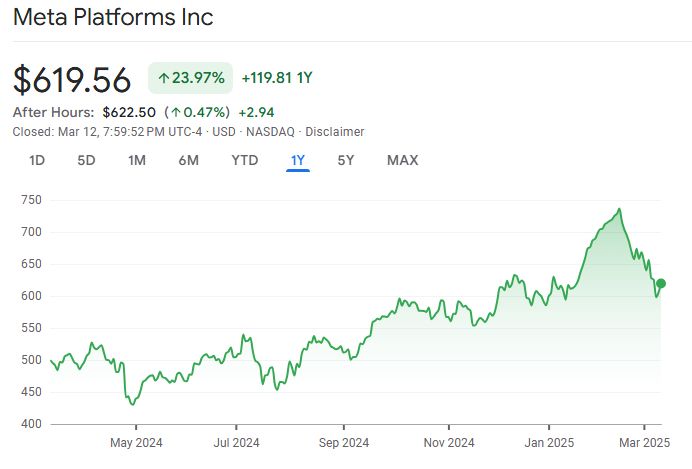
Source: Google Finance
DCF Valuation Inputs
- Discount Rate: 9.5%
- Terminal Growth Rate: 4%
- Weighted Average Cost of Capital (WACC): 9.5%
Forecasted Free Cash Flows (FCFs) in Billions
| Year | FCF ($B) | Present Value ($B) |
|---|---|---|
| 2025 | 50 | 45.7 |
| 2026 | 58 | 48.3 |
| 2027 | 67 | 50.5 |
| 2028 | 77.5 | 52.5 |
| 2029 | 89 | 54.3 |
Total Present Value of FCFs = $251.3 billion
Terminal Value Calculation
Using the perpetuity growth model:
Terminal Value = (FCF in 2029 × (1 + Terminal Growth Rate)) ÷ (Discount Rate – Terminal Growth Rate)
= (89 × 1.04) ÷ (0.095 – 0.04)
= 92.56 ÷ 0.055
= $1,682.91 billion
Present Value of Terminal Value
PV of Terminal Value = Terminal Value ÷ (1 + WACC)^5
= 1,682.91 ÷ (1.095)^5
= 1,682.91 ÷ 1.5703
= $1,071.5 billion
Enterprise Value Calculation
Enterprise Value = Total Present Value of FCFs + PV of Terminal Value
= 251.3 + 1,071.5
= $1,322.8 billion
Net Debt Calculation
As of December 31, 2024:
- Total Debt: $49.06 billion
- Total Cash: $77.81 billion
Net Debt = Total Debt – Total Cash
= 49.06 – 77.81
= – $28.75 billion (Net Cash Position)
Equity Value Calculation
Equity Value = Enterprise Value + Net Cash
= 1,322.8 + 28.75
= $1,351.55 billion
Per-Share DCF Value
- Shares Outstanding: 2.534 billion
Per-Share DCF Value = Equity Value ÷ Shares Outstanding
= 1,351.55 ÷ 2.534
= $533.36
Conclusion
| DCF Value | Current Price | Margin of Safety |
|---|---|---|
| $533.36 | $505.12 | 5.59% |
Based on this DCF valuation, Meta appears slightly undervalued. The estimated intrinsic value of $533.36 per share is higher than the current market price of $505.12, providing a 5.59% margin of safety. This suggests Meta may present a moderate buying opportunity given its strong free cash flow generation, AI-driven ad revenue growth, and investment in future technologies.
For all the latest news and podcasts, join our free newsletter here.
Don’t forget to check out our FREE Large Cap 1000 – Stock Screener, here at The Acquirer’s Multiple:
