In their latest Q3 2021 Market Commentary, Pzena discuss the compelling opportunity in value stocks. Here’s an excerpt from the commentary:
We have argued for some time that the opportunity in value stocks is compelling: valuations are cheap, operating metrics are strong, and they offer high single-digit to low double-digit real returns depending on geography.
Despite value’s fantastic fundamentals, it has seen uneven performance among the ebbs and flows of macroeconomic uncertainties. Given the severe downturn in economic activity that occurred at the outset of the pandemic, it should not be surprising that economic recovery is coming in fits and starts. We believe long-term investors should be rewarded over a long and enduring pro-value cycle if they look past these temporary setbacks, ultimately benefitting from the fundamentals that remain in place.
POSITIVE REAL EARNINGS YIELD FOR VALUE
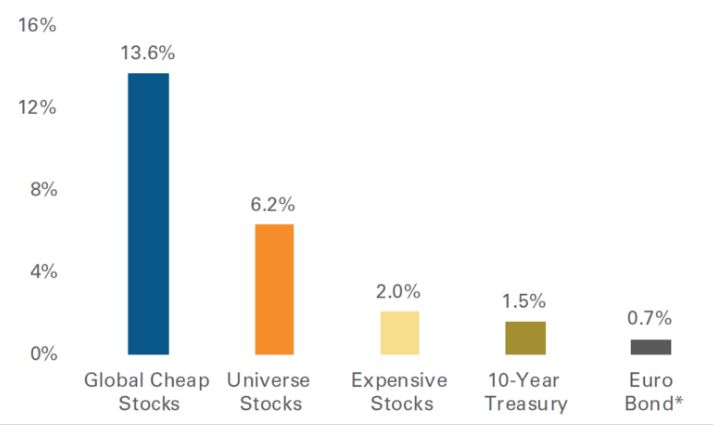
Value stocks are one of the few investment opportunities offering positive projected real returns, where the earnings yield is well in excess of expected inflation. The earnings yield of cheap stocks, or the price one pays for normalized earnings, ranges from low double digits to mid-teens across the world. Alternatively, investors have bid up the price on global fixed income products to the point where there is little yield to be earned on “safe” assets (Figure 1).
Figure 1 – Cheap Stocks Currently Have Superior Earnings Yields
Source: FactSet, Pzena analysis
Cheap/Expensive earnings yield are based on the median stock within the cheapest and most expensive quintile based on price-to-normal earnings. The quintiles are measured on an equally weighted basis within the ~2,000 largest global stock universe. Price-to-normal earnings are Pzena’s estimates. Universe stocks is the earnings yield of the median stock within the entire universe. *Yield of the Bloomberg Barclays Euro Aggregate 10+Y Index. The index is a benchmark that measures the Treasury component of the Euro-Aggregate and consists of fixed-rate, investment grade public obligations of the sovereign countries in the eurozone; the index currently contains euro-denominated issues from 17 countries. Data as of September 30, 2021.
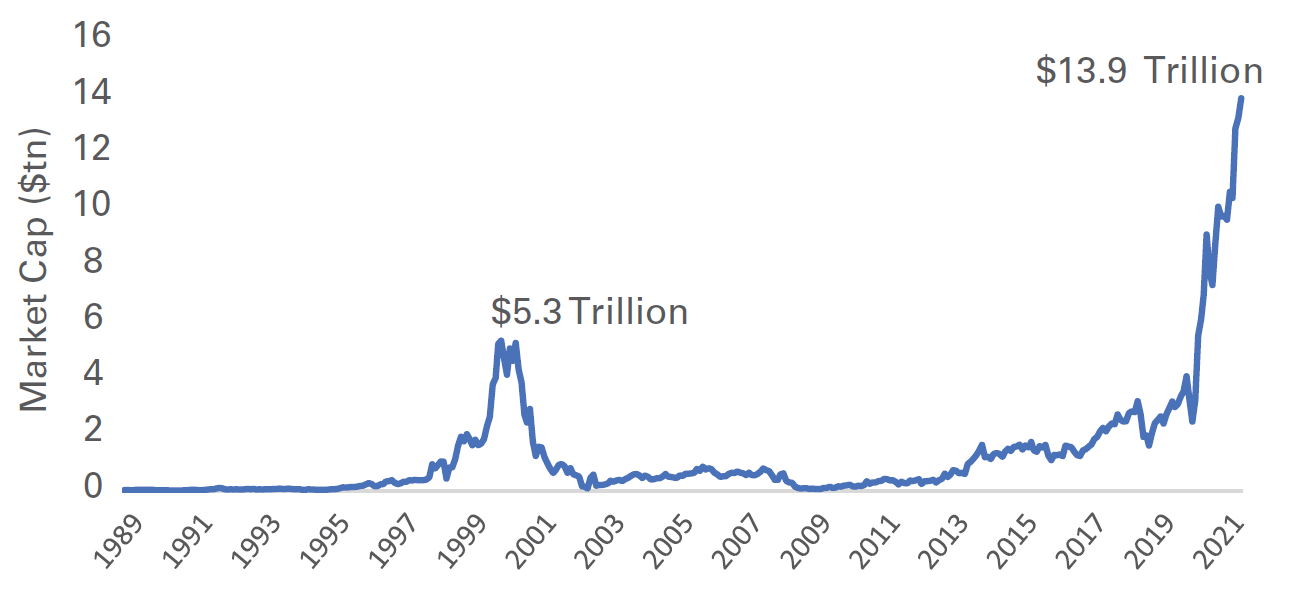
Meanwhile, expensive stocks have continued to get more expensive. Today the market cap of stocks that are trading at greater than 10x sales is more than twice what it was in the internet bubble and three times the market cap of the cheapest quintile (Figure 2).
Figure 2 – Total Market Cap of Stocks with Price-to-Sales Greater than 10x
Source: Kailash Concepts
Universe is the Russell 3000 Index. Data as of August 31, 2021.
However, history has not been kind to stocks that trade over 10x sales. Over the last 32 years, stocks trading at greater than 10x sales have generated a compound annual return of -0.3%, versus the broader US market of about 11.0%.
You can read the entire commentary here:
Pzena: Q3 2021 Market Commentary
For all the latest news and podcasts, join our free newsletter here.
Don’t forget to check out our FREE Large Cap 1000 – Stock Screener, here at The Acquirer’s Multiple:


