Interesting post out of Wall Street Daily on the efficacy of the acquirer’s multiple by Alan Gula, CFA:
The price-to-earnings (P/E) ratio is perhaps the most popular valuation metric used by investors.
Pull up any finance website stock quote page, and you’ll find the P/E ratio neatly calculated for you.
The reason it’s so widely used is because it’s simple and intuitive.
You take the price of a stock and divide it by either trailing or forward (estimated) earnings per share (EPS). The lower the resulting figure, the better the valuation, all else equal.
But the P/E ratio has some significant flaws.
One of its biggest weaknesses is that it ignores the level of debt on a company’s balance sheet.
This is critical right now because so many companies are issuing debt to buy back stock or acquire other firms.
Now, there is a better metric we can use to assess a firm’s total valuation – not just its equity component.
It’s a bit more complicated, but as you’ll see, a little extra work is definitely worth the effort.
Think Like a Corporate Raider
The valuation metric I’m referring to is the enterprise value-to-EBITDA ratio.
Enterprise value (EV) is calculated in the following way:
EV = Market Cap + Total Debt + Preferred Stock + Minority Interest – Cash
This gives us a theoretical takeover value, which is similar to how an investment banker might value the company.
The denominator of the ratio is EBITDA, which stands for earnings before interest, taxes, depreciation and amortization. Basically, it’s the earnings that are available to all stakeholders.
Similar to the P/E ratio, a lower EV/EBITDA represents a cheaper valuation, all else equal.
Luckily, the EV/trailing EBITDA ratio can be found on the Yahoo! Finance Key Statistics page, so we don’t have to dig through financial statements.
Now for the payoff…
The Golden Ratio
The EV/EBITDA ratio could be the single-best valuation metric around.
Academic research has shown that stock selection based on EV/EBITDA outperforms P/E and price-to-book value methodologies on a risk-adjusted basis.
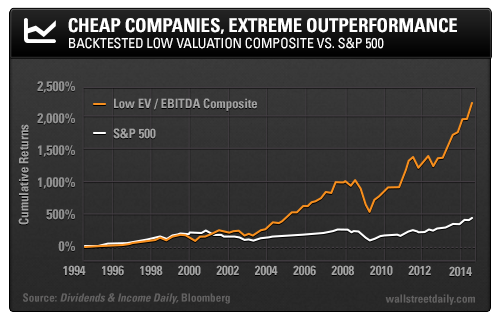
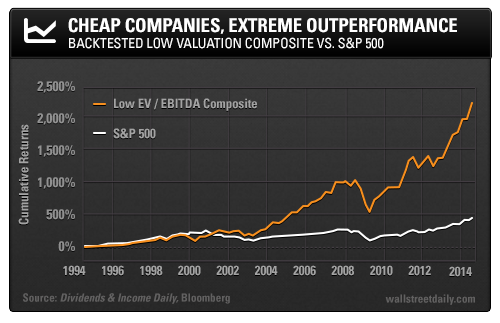
Using a Bloomberg backtest, we can see how a simple strategy based on low EV/EBITDA would have performed in the past.
Each quarter, S&P 500 companies with EV/EBITDA ratios ranking in the lowest 10% are placed into the Low EV/EBITDA Composite, which is market cap weighted just like the S&P 500.
So what happens when you invest in just these companies with low EV/EBITDA ratios?
Well, the remarkable results can be seen below:
With a return of 2,227% over the past 20 years, this strategy has simply blown away the S&P 500.
Cheap companies outperform over time, plain and simple.
If you haven’t been using EV/EBITDA as a guide, now is a great time to go through your portfolio and look up this crucial metric for each of your stocks.
The median EV/EBITDA ratio for the S&P 500 is currently 11.4x. If we own a stock with a much higher multiple, there better be a really good reason.
Of course, the ultimate goal is to select stocks with both low EV/EBITDA ratios and high dividend growth. Now that’s the basis for a powerful strategy and the key to an early retirement!
Source: A Superior Valuation Metric: Enterprise Value (EV) to EBITDA | Wall Street Daily
For all the latest news and podcasts, join our free newsletter here.
Don’t forget to check out our FREE Large Cap 1000 – Stock Screener, here at The Acquirer’s Multiple:


3 Comments on “A Superior Valuation Metric: Enterprise Value (EV) to EBITDA | Wall Street Daily”
Thanks. Maybe the number dosent tell all the story….
We have to double check why the ev/ebitda is low.
Thanks for the article
its like a screener for me. but it’s hard to judge when you have low acquirer’s multiple while company sells his segment operations year after year.
Is there a etf for low ev/ebitda ? Maybe its a good idea for an etf in order to reduce risk…