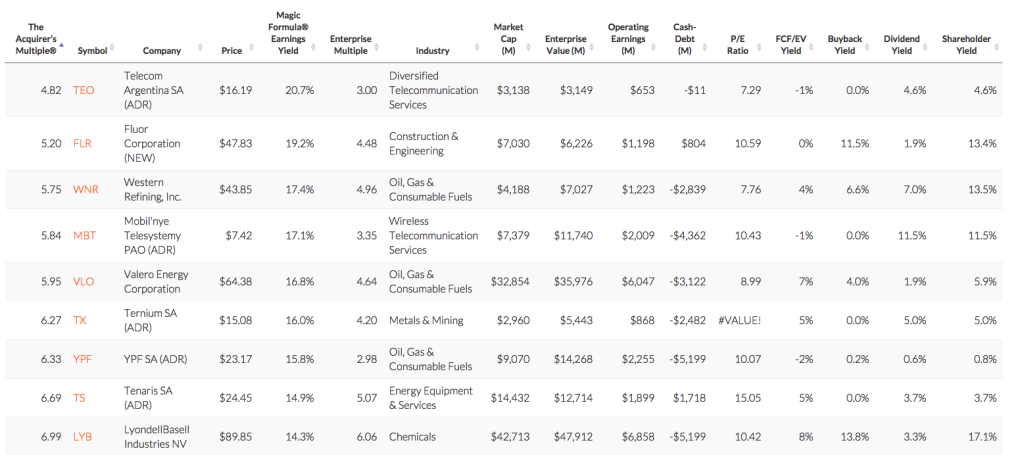
I’ve retooled the screeners to add some new information at the request of some users. In addition to the acquirer’s multiple and its components–enterprise value and operating earnings–, and descriptive data–share price, symbol, name, industry, and market capitalization–the screener now shows several additional fundamental measures.
Those measures include each company’s net cash position (cash and equivalents less total debt), the price-to-earnings ratio (where earnings exclude extraordinary items), free cash flow / enterprise value, buyback yield (trailing twelve months share repurchases / market capitalization), dividend yield and shareholder yield (which is buyback yield plus dividend yield).
I’m interested in constantly improving the screeners to make them more useful, so if you have any suggestions, feels free to drop me a line at tobias@acquirersmultiple.com or leave a comment below.
For all the latest news and podcasts, join our free newsletter here.
Don’t forget to check out our FREE Large Cap 1000 – Stock Screener, here at The Acquirer’s Multiple:


2 Comments on “Changes to the Screeners’ Output”
Hi Tobias, any plans to add in a column for F score or Z score? These metrics are mentioned in your columns, so I take it they hold enough significance to potentially improve performance.
I eliminate the worst on those metrics because they shift the performance of the universe up, but they don’t add any performance beyond that.