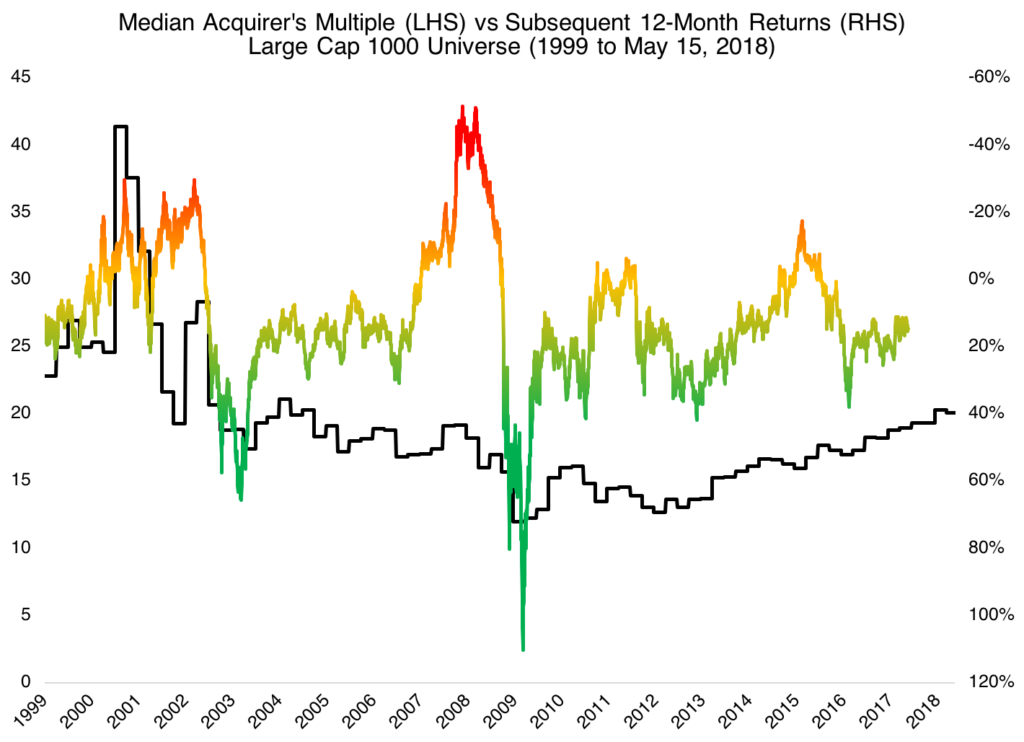
The chart above shows the median acquirer’s multiple (LHS) in the largest 1000 US-listed stocks and ADRs each quarter since 1999 versus the subsequent 12-month returns for the universe (RHS, inverted). The relationship isn’t particularly predictive (R-squared is 0.12). The median acquirer’s multiple right now is 20.11. That sits at the 78th percentile of overvaluation since 1999, which has been an atypically expensive two decades. It’s interesting that the median acquirer’s multiple fell until 2009 and has risen steadily since.
For all the latest news and podcasts, join our free newsletter here.
Don’t forget to check out our FREE Large Cap 1000 – Stock Screener, here at The Acquirer’s Multiple:


