
What’s new at The Acquirer’s Multiple
Saturday, October 31, 2026
The Acquirer’s Multiple® has a new website. The screens still rank stocks the way an acquirer would, by what the whole business costs against what it earns, but almost everything around them is new. Here’s what changed, and what you can do with a free account or a membership.
An AI analyst on every stock in the screens
The biggest change is the AI analyst. After every screen update it reads the latest filings, news and price moves for the stocks in the screens and writes up what changed and why it matters for a value investor. Every figure it quotes is checked against the screen data before it’s published.
Each write-up opens with the analyst’s answer, then makes the case in four parts:
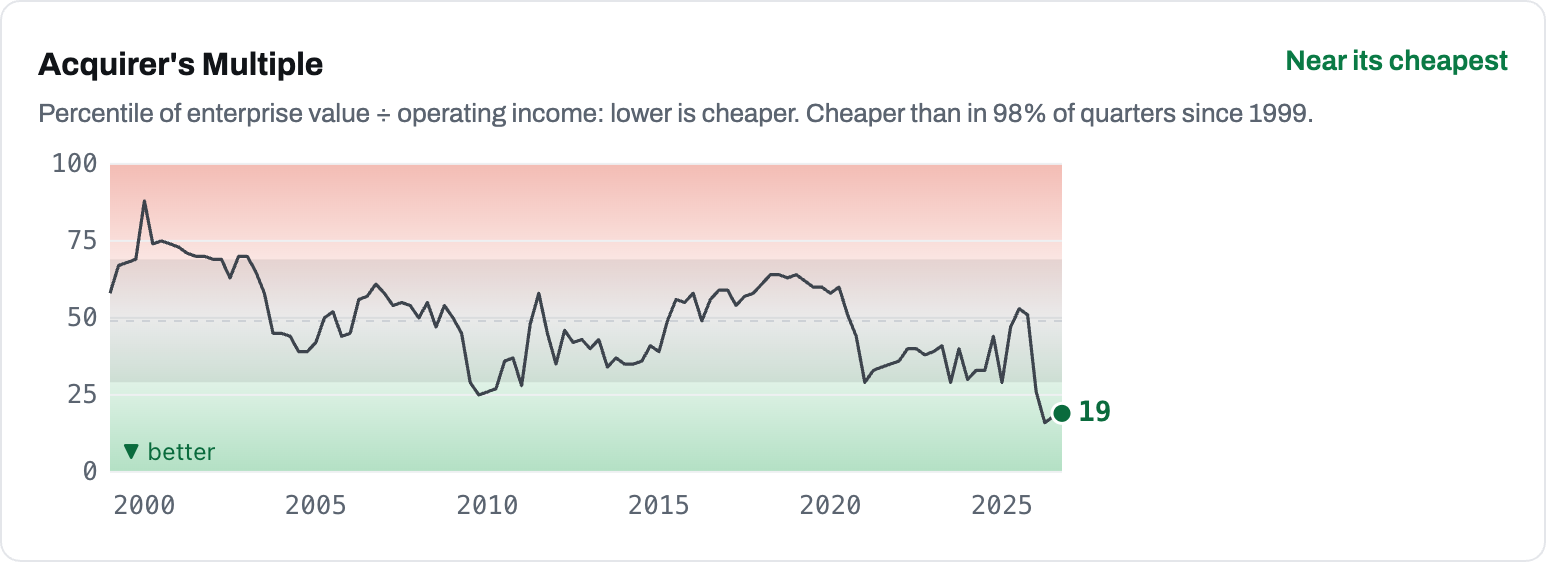
- Value: how cheap the stock is against the whole market, its industry and its sector.
- The five-year record: the turning points in the share price and what drove them.
- Catalysts: buybacks, activists, takeover interest or spin-offs, with the evidence and how likely each looks.
- Risks: what could make the cheap price a value trap.
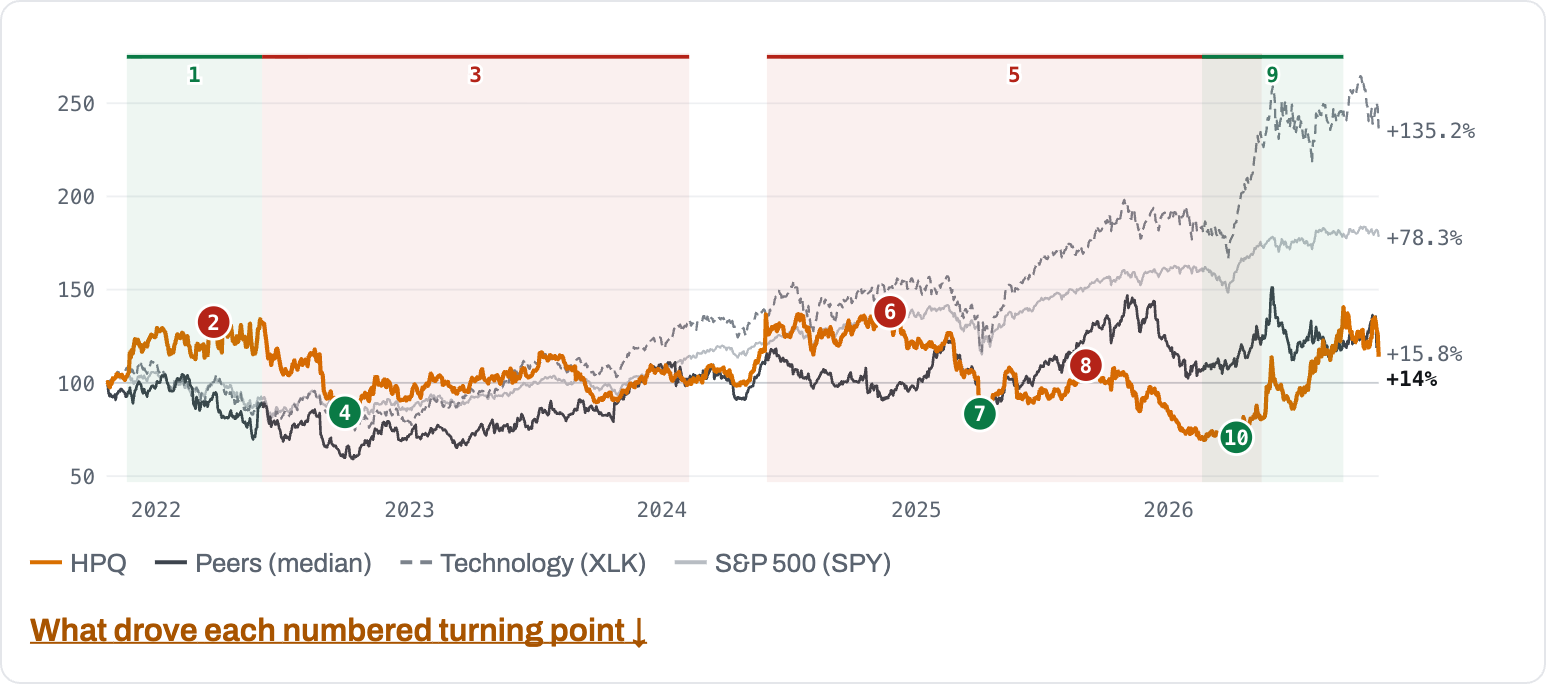
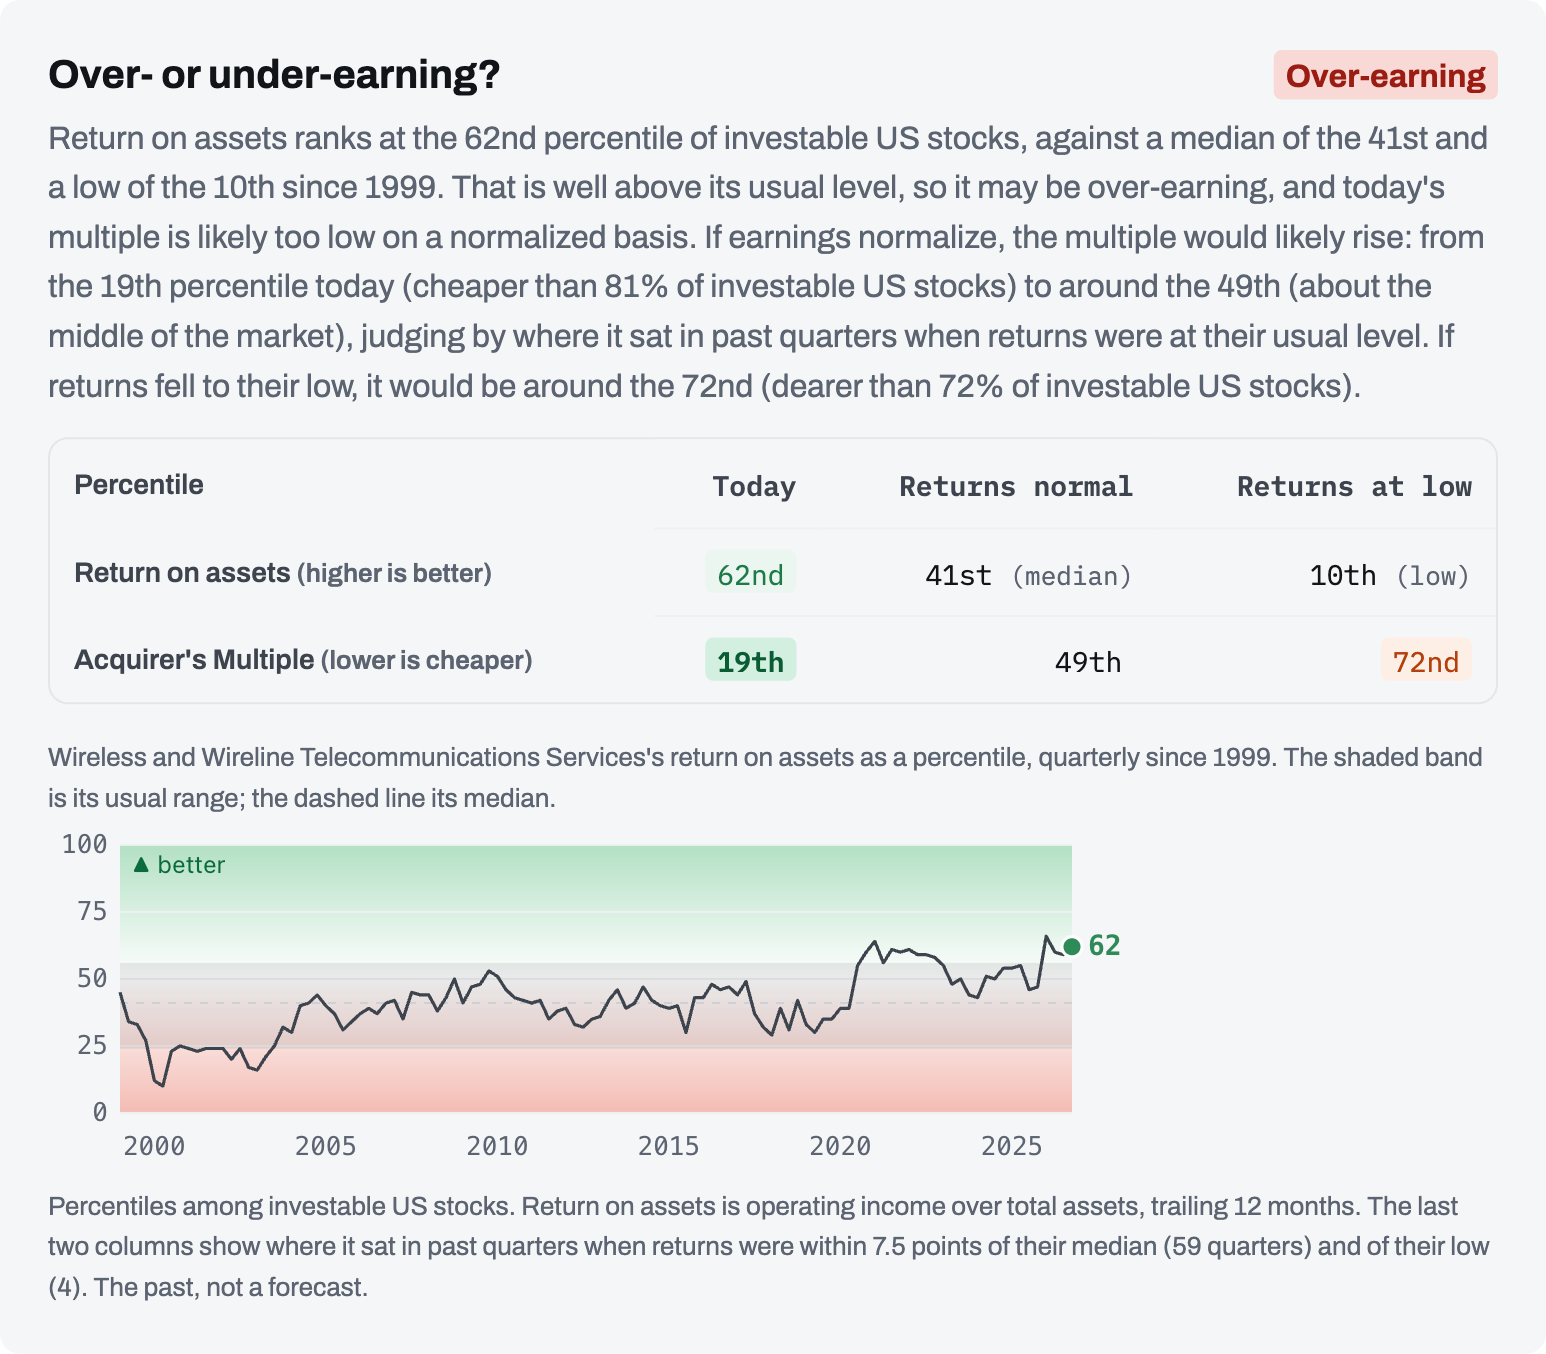
It also asks whether the business is over- or under-earning: whether today’s returns are unusually high or low against its own history and its industry’s, and what the multiple would look like if earnings returned to normal. Sources are listed with every write-up.
The Today page leads with the analyst’s biggest stories in the cheapest stocks we track, and Reports collects every write-up from the past month.
A free story every day
Each trading day, the analyst’s biggest story is free to read in full for everyone, no account needed. It’s the story at the top of the Today page. We also gather the week’s free stories into the weekly email, so if you’re on our list, you’ll see them in the Sunday email.
What you get with a free account
Signing up takes just your email. A free account gets you:
- The full Large Cap 1000 screen: the 30 cheapest of the largest 1,000 US-listed stocks, with every name and number, and a CSV download.
- A page for every Large Cap stock: how it ranks against the market and its industry, the value-trap check, and its price against its returns.
- The AI analyst’s preview on each Large Cap stock: the headline and the value angle.
- Ask the analyst on the FAQ page: five questions a month about value investing, the method and the screens.
What members get
Members get the whole thing:
- All four screens: Large Cap 1000, All Investable, Small and Micro Cap, and Canada All TSX. The smaller-cap screens are where the multiples are lowest: the median stock in the Small and Micro Cap screen trades at less than half the Large Cap screen’s multiple.
- Every AI analyst write-up, on every stock in every screen, updated after each screen update. You can run or refresh the analysis on any stock yourself.
- Ask the analyst on every stock page: follow-up questions about the business, today’s news or the risks, with sourced answers.
- Tear sheets: a one-page summary of each stock to download and keep.
Membership is $49 a month, or $499 a year with a 30-day money-back guarantee. You can cancel any time. See membership.
More to explore
- Industry View: where every industry’s valuation and returns sit against its own history since 1999, and whether it looks to be over- or under-earning.
- Track record: each screen’s picks tracked from the week they enter to the week they leave.
- Podcast: watch the latest episode of The Acquirers Podcast, or listen to any of more than 450 episodes, right on the page.
- FAQ: how the multiple works, why we use operating earnings rather than EBIT, and how to use the screens.
Start with the free account
If you haven’t yet, sign up free and open the Large Cap 1000 screen. Read today’s free story. When you want the analyst’s full take on every stock in all four screens, join as a member.
Questions or feedback on the new site? Email tobias@acquirersmultiple.com.