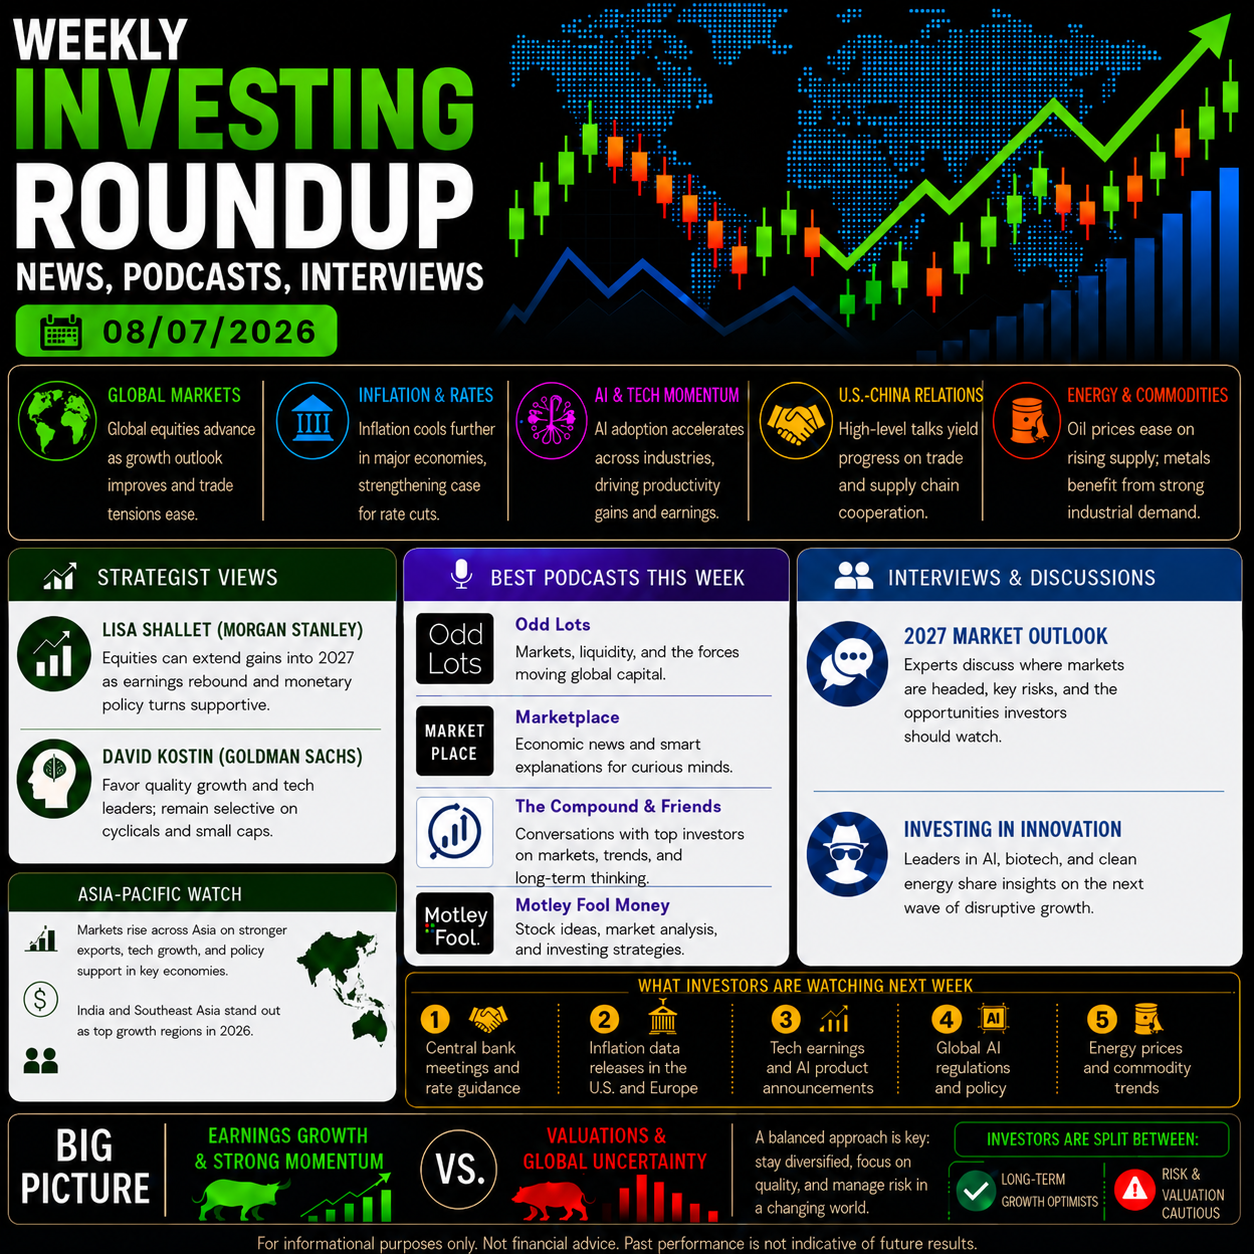
Weekly Investing Roundup – News, Podcasts, Interviews (08/07/2026)
Thursday, August 6, 2026 · Johnny Hopkins
This week’s best investing news:
Mohnish Pabrai’s Brutally Honest Thoughts on the Stock Market (New Money)
Why Bill Ackman Gives Pershing Square Cleaning Crew Millions in Equity (Fortune)
Evidence-Based Forecasting Techniques for the Average Investor (Verdad)
Ray Dalio: I Predicted The 2008 CRASH, I Know What Comes Next! (Diary of a CEO)
Jim Rogers – He Made 4200% At The World’s TOP Hedge Fund (He’s SOLD EVERYTHING) (WOR)
Matthew McLennan: Why Boring Businesses Win (RWH)
Taylor Morrison CEO: ‘Lot of runway’ with Berkshire (Bloomberg)
Investing in Momentum (A Wealth of Common Sense)
Everyone loves credit! (Havenstein)
Corporate Insiders Are More Bearish Than They Have Been In Decades (The Felder Report)
New Levels in the Stock Market by Charles Amos Dice (Novel)
For most retirees, the greatest fear is not death—it is running out of money before they die. (HumbleDollar)
Too Much Investment Innovation Exploits Investor Behaviour (Behavioural Investment)
Data-centre reality check could slam brakes on AI earnings boom (Klement)
The No. 1 reason why I look forward to earnings season (TKer)
MiB: Som Seif, Purpose Unlimited (Masters in Business)
Third Point Q2 2026 Investor Letter (TP)
This week’s best value investing news:
Pzena Investment Management Q2 2026 Commentary (Pzena)
Third Avenue’s Matt Fine discusses Harley-Davidson in Value Investor Insight (VII)
Lessons from 40 years of investing (ISN)
This week’s Fear & Greed Index:

This week’s best investing podcasts:
Gavin Baker – AI Market Jitters (Invest Like the Best)
When the Greatest Stock Speculator Met the Greatest Gambler (MicroCapClub)
Barry Ritholtz: “90% of financial products are crap” | #421 (TRR)
Liaquat Ahamed on the Railroad Bubble That Crashed the World | #642 (The Meb Faber Show)
The Most Misread Commodity Setup with Rick Rule, Founder & CEO of Rule Investment Media (Planet MicroCap)
The Mindset Behind Building Billion-Dollar Companies | Brad Jacobs (Parrish)
Stefan Sharkansky: The Retirement Spending Plan That Adapts as Markets Change (The Long View)
Peter Lee and Jon Nickow: How to Nurture Future Financial Advisors (Barron’s)
The economics of the AI companies is being tested with Alex Pollak | Loftus Peak (EM)
4% Inflation. Stretched Valuations. Why Is the Market Still Risk-On? | Tian Yang (ER)
Stacie Mintz – Turning Qualitative Fundamentals into Quantitative Factors (S7E33) (Flirting with Models)
This week’s Buffett Indicator:
Strongly Overvalued

This week’s best investing research:
Family and friends: The most important source of financial advice? (Alpha Architect)
Consumer sentiment not supporting market sentiment (Disciplined Systematic Global Macro Views)
This week’s best investing tweet:
Momentum posted it’s worst month since the 2000 top. It’s ripped for 2-straight days, but the history of Mo peaks/crashes suggests rally (now) then drift with downside. The hard part usually shows up months out. $SPY $SMH pic.twitter.com/naLNW2H8KR
— RenMac: Renaissance Macro Research (@RenMacLLC) August 5, 2026
This week’s best investing graphic:
Mapped: How the World’s Income Map Changed in 30 Years (Visual Capitalist)

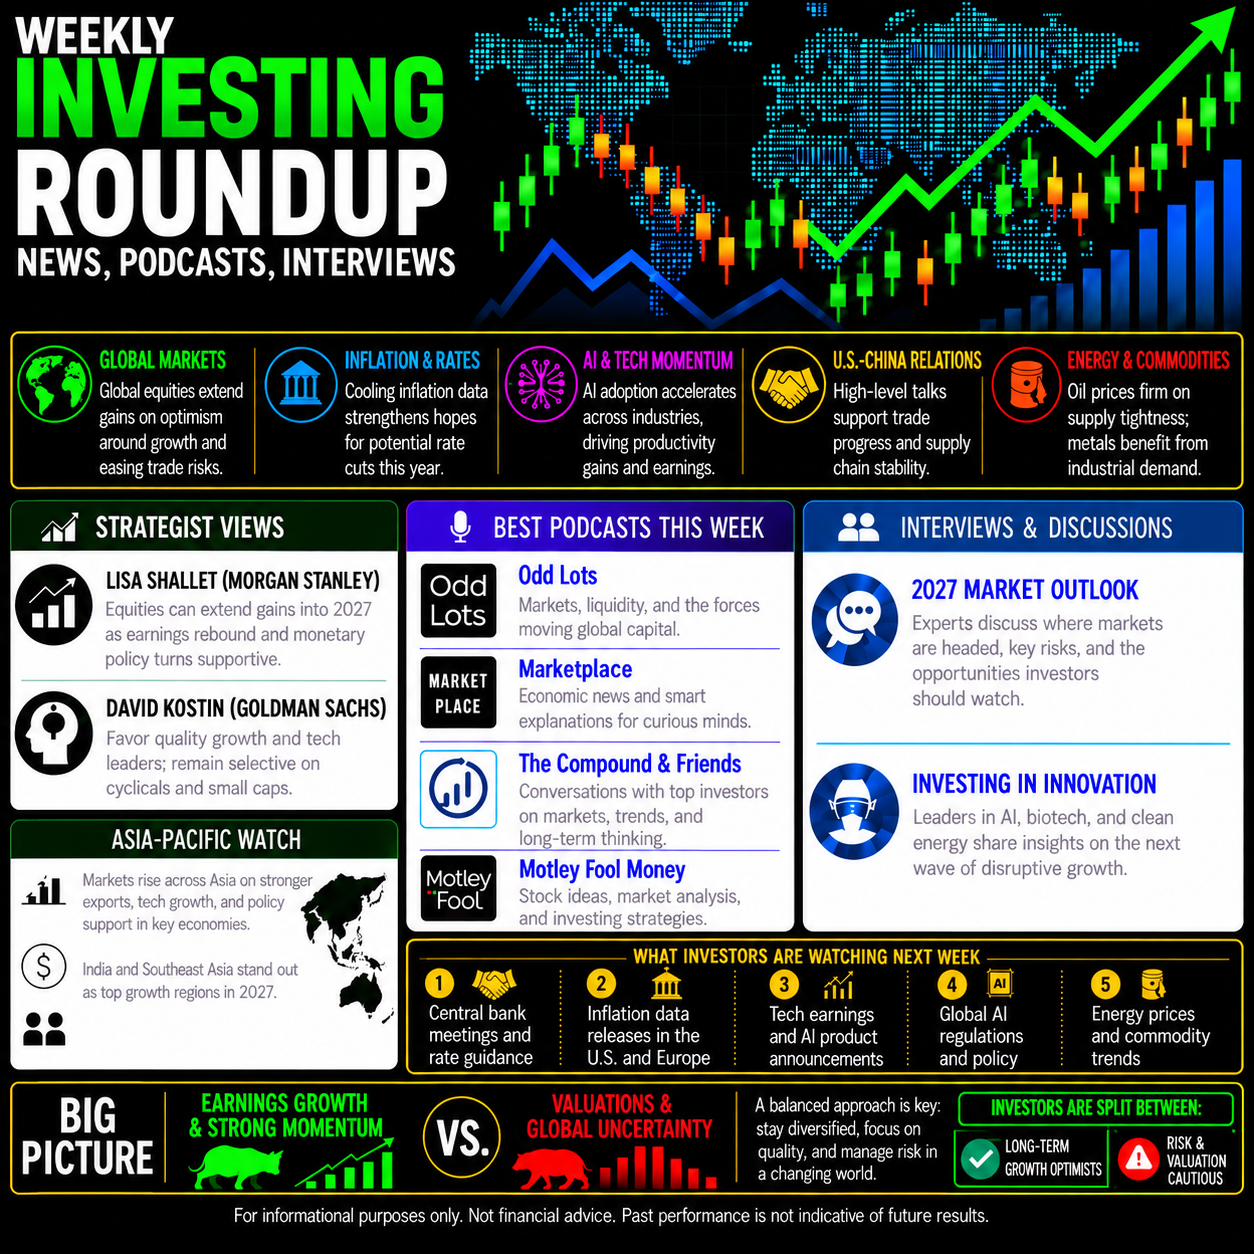 Weekly Investing Roundup – News, Podcasts, Interviews (11/13/2026)
 Small and Micro Cap Stocks: Where Deep Value Meets Cash Flow
 AI Investing Lessons: Why Revolutionary Technologies Can Still Be Bad Investments