Weekly Investing Roundup – News, Podcasts, Interviews (04/17/2026)
Thursday, April 16, 2026 · Johnny Hopkins
This week’s best investing news:
David Einhorn signals caution as his hedge fund Greenlight prioritizes capital protection (CNBC)
The Big Picture: Outlook from the Co-CEOs at Oaktree Conference 2026 (OakTree)
Berkshire electric utility’s court win could save it billions (CNBC)
March Madness (Verdad)
A ‘Suez’ Moment For The U.S.? (The Felder Report)
What Do You Believe About Investing? (Behavioural Investment)
America’s top bankers confirm: The economy remains resilient (TKer)
The Uncommon Sense of Jim Weber: How Saying No Built a Billion-Dollar Brand at Brooks (Kingswell)
More risk, same return (Klement)
Markets and Good Weather (Stef)
Avoid the noise, buy the market and stay invested (HumbleDollar)
Why Portfolio Diversification Has Paid Off—but More Isn’t Always Better (Morningstar)
MiB: Mike Pyle, BlackRock’s Portfolio Management Group (Masters in Business)
Polen Capital: Navigating Credit Risk (Polen)
This week’s best value investing news:
The Iran War Has Fired Up Value Investing. But What Next? (Bloomberg)
A century of value investing (IFA)
Why Value Investing Works (And Why It Has to Stop Working First) (Safal)
Third Avenue Management: Small-Cap Value Strategy Overview and Insights 2026 (TA)
This week’s Fear & Greed Index:

This week’s best investing podcasts:
Mario Harik: Playing to Win (The Knowledge Project)
Software Winners & Losers in the Age of AI (w/Alex Rubalcava & Paul Bricault) | #626 (The Meb Faber Show)
Omani Carson: What He Learned After ‘Winning’ the Game (Barron’s)
The Man Who Built NVIDIA (with Stephen Witt) (EconTalk)
How to Get a 9% Raise Every Year with Dividend Stocks (WealthTrack)
Defending Your Convictions (MicroCapClub)
Asian Investment Landscape with Michael Fritzell, Editor of Asian Century Stocks (Planet MicroCap)
Scott Nolan – SpaceX, Founders Fund, and Rebuilding American Uranium Enrichment (Invest Like the Best)
Mark Higgins, CFA, and Leyla Kunimoto: Cracks in Private Markets and the Risks of Semi-Liquid Funds (EI)
The Market the Tweets Can’t Break | What the Options Market Tells Us About What Comes Next (ER)
This week’s Buffett Indicator:
Strongly Overvalued

This week’s best investing research:
The Many Facets of Stock Momentum: Distinguishing Factor and Stock Components (ALphaArchitect)
Diversification and redundancy with trend-following (Disciplined Systematic Global Macro Views)
This week’s best investing tweet:
Where are we in the valuation cycle?
* Current reading: ~+162%
* That is above 3 standard deviations
* Only comparable levels: late 1990s / 2021 peak* Base case (5–10 yrs): low single-digit real returns for the index
* Bear case: major drawdown (-40–60%)
* Bull case: prolonged… pic.twitter.com/TVlHG60yZE— Tobias Carlisle (@Greenbackd) April 13, 2026
This week’s best investing graphic:
Every S&P 500 Company in One Giant Chart (Visual Capitalist)

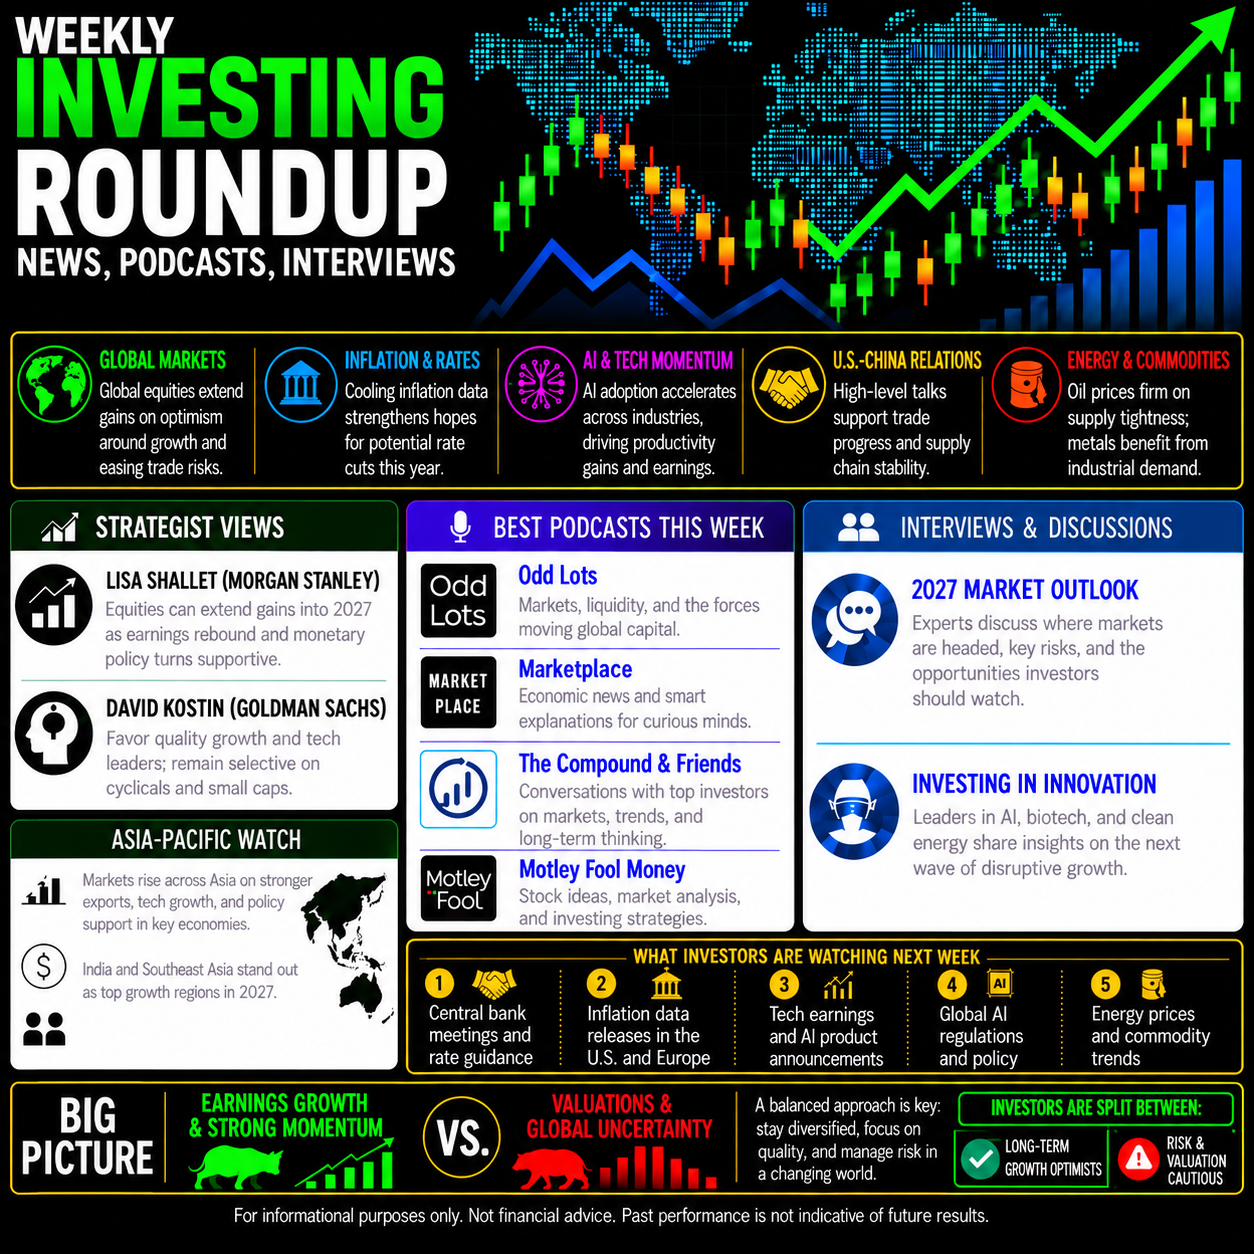 Weekly Investing Roundup – News, Podcasts, Interviews (11/13/2026)
 Small and Micro Cap Stocks: Where Deep Value Meets Cash Flow
 AI Investing Lessons: Why Revolutionary Technologies Can Still Be Bad Investments