
Based on the improved performance metrics which we recently added to our stock screens, Netflix Inc (NFLX) could be a great value stock:
Netflix’s primary business is a streaming video on demand service now available in almost every country worldwide except China. Netflix delivers original and third-party digital video content to PCs, internet-connected TVs, and consumer electronic devices, including tablets, video game consoles, Apple TV, Roku, and Chromecast. In 2011, Netflix introduced DVD-only plans and separated the combined streaming and DVD plans, making it necessary for subscribers who want both to have separate plans.
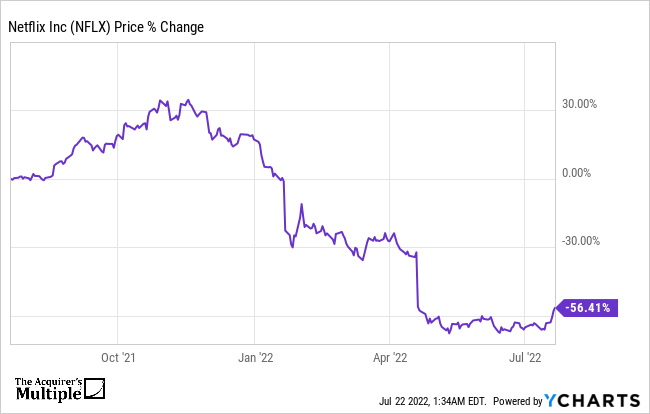
A quick look at the share price history for the company (below) over the past twelve months shows that the price is down 56%.

Even though the company has a market cap of $99.46 Billion and a price of $223.88, here’s why the company could be a great value stock:
Acquirer’s Multiple YChart

NFLX EV to EBIT data by YCharts
Bubble Map
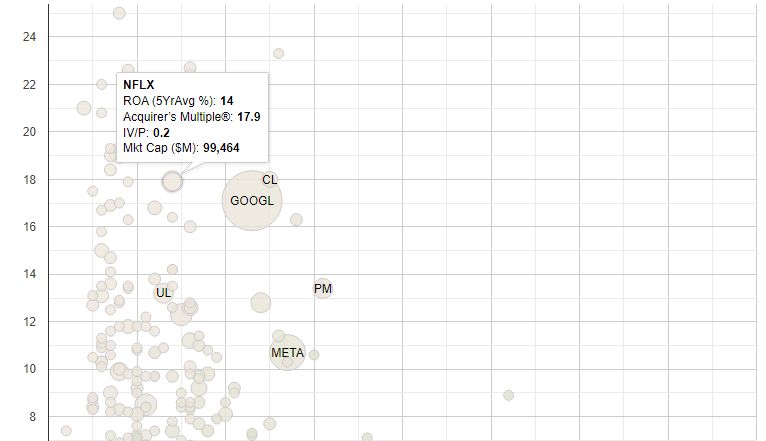
Implied Value To Price
0.20
IV/P or Intrinsic Value to Price: This column compares the stock’s Implied Value (Earning Power, Incremental Growth plus Shareholder Yield)to the current price. The number represents the value offered for each dollar invested. IV/P greater than one (1) indicates that each dollar invested receives more than $1 of Intrinsic Value. IV/P less than one indicates less than $1 of Intrinsic Value for each dollar invested. The IV/P is necessarily a rough estimate. These stocks benefit from mean reversion in multiples, and no mean reversion in fundamentals. Where the market is applying a lower Acquirers Multiple to a stock’s Expected Return, it may indicate an undervalued opportunity. This is a profitability-at-a-reasonable price screen. Historically, getting more an IV/P lower than about 0.6–each dollar invested buys 60 cents or less of Intrinsic Value–is overvalued.
—
Acquirer’s Multiple
17.90
Acquirers Multiple: Ranking on this column shows the stocks with the lowest multiples in the universes. These are deep value stocks that may benefit from mean reversion in the underlying businesses. This is the traditional deep value screen.
—
Expected Return (%)
10.50
E(r) or Expected Return (%): The sum of a stock’s Earning Power, Incremental Growth and Shareholder Yield. This is a variation of Bruce Greenwald’s calculation. It assumes no mean reversion in multiples or fundamentals.
—
Return On Assets (5YAvg%)
14
ROA or Return on Assets: Ranking on this column shows the stocks with the highest five-year average operating income returns on total assets. These are the most profitable companies in the universes over the last five years.
—
Incremental Growth (%)
-3.70
Incremental Growth (%): This is the reinvestment rate (capital expenditures less depreciation divided by total assets) multiplied by ROA. It can be positive–if cap ex exceeds depreciation–or negative–if cap ex falls short of depreciation. Companies with a high reinvestment rate and a high ROA will score higher on the Incremental Growth metric. Low or negative reinvestment rates and a low ROA will score lower on the Incremental Growth metric.
—
FCF Yield (%)
-0.05
FCF Yield or Free Cash Flow Yield: Trailing Twelve-Month Free Cash Flow divided by Market Capitalization. Another traditional deep value screen. These stocks benefit from mean reversion in fundamentals and multiples.
—
Shareholder Yield (%)
0.50
For all the latest news and podcasts, join our free newsletter here.
Don’t forget to check out our FREE Large Cap 1000 – Stock Screener, here at The Acquirer’s Multiple:

