

Pzena Investment Management recently released an article titled Volatility, Wide Spreads, and Value Stock Returns which illustrates how value stocks recover stronger following periods of volatility like we’ve had this year. Here’s an excerpt from that article:
Daily volatility of the average stock at the end of March was as high as it was during the Great Depression in 1929 (Figure 1), resulting in a wild ride for equity investors (Figure 2). During one eight-day stretch, for example, the MSCI World Index returned -7.2%, +2.9%, -3.9%, -9.9%, +5.9%, -9.5%, +4.1%, -5.16%. Such wild swings indicate total uncertainty, as reflected in indices across the world.
Figure 1: Uncertainty Jumped to Depression-Era Levels
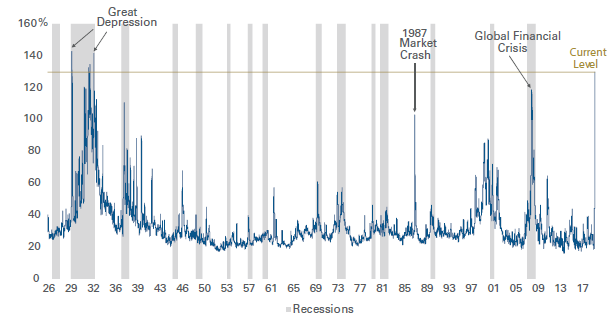
Source: Empirical Research Partners.
¹Calculated using daily return volatility measured over 21-day windows within the largest ~1,000 US stocks ranked by market cap.
Past performance is not indicative of future returns.
Figure 2: Extreme Uncertainty Reflected in Extreme Price Action
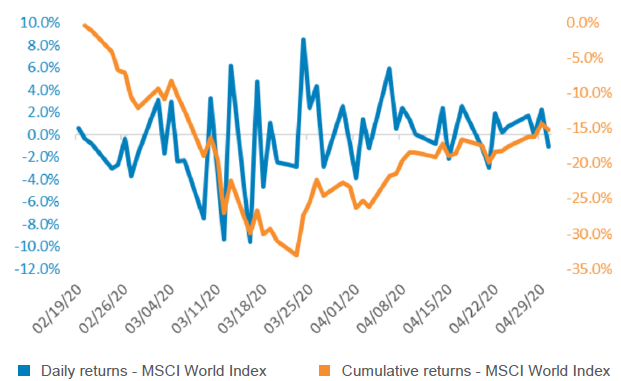
Source: FactSet, MSCI, Pzena analysis.
Past performance is not indicative of future returns.
From the February 19 high to the March 23 trough, the MSCI World Index declined 34.0%. The index subsequently bounced off that low, rising 28.5% through April (its best month since February 1991). That represents a 55% retracement, resulting in a 15.2% overall decline (Figure 2).
Yet, investors remain uncertain, asking, “How long will this economic crisis last? Are we headed into the next Great Depression?” The bear case says we are in the early stages; we just don’t know how bad it will get or how long it will last. The bull case says this is a virus; it’s temporary, and while we don’t know the exact timing or path, recovery will come.
Of course, we don’t know which scenario will play out; in the meantime, what is an investor to do? As usual during a crisis, the broad market response was to flee. Flee to safety, which, in March, primarily meant government bonds. And, if equity exposure is absolutely necessary, flee to what’s been working; run away from value stocks. Indeed, as investors bid stocks up in April, growth stocks remained in favor.
Compare this to what happened during the Depression. If an investor had bought the broad market index after the November 1929 crash, at the peak in market volatility, that investor would have lost almost 18% one year later. An investor who bought a basket of the deepest value stocks at the same time would have fared much worse, losing almost 34%. If the investor had a five-year horizon, however, the results were dramatically different. The broad market investor would have lost 10% per year, while the value investor earned 10% per year (Figure 3). Most people are unable to stay the course, and we believe this is where the opportunity is created.
Figure 3: Value Investors’ Five-Year Gains After the Crash
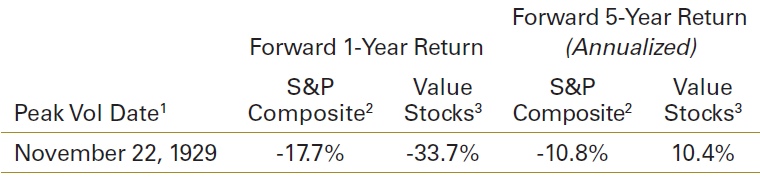
Source: Empirical Research Partners, Kenneth R. French, Robert J. Shiller, Pzena analysis
¹Calculated using daily return volatility measured over 21-day windows within the largest ~1,000 US stocks ranked by market cap.
²Robert J. Shiller S&P Composite data.
³Fama-French database – universe returns include stocks within the NYSE, AMEX, and NASDAQ for which there is book equity and market equity data; value stocks include the first quintile of (equal-weighted) stocks formed on a book equity/market equity basis.
All returns using monthly data and annualized in US dollars. This does not represent any Pzena product or service. Past performance is not indicative of future returns.
If this period turns out to be something other than depression-like, well, we believe the choice is clear. In almost every period where volatility eased, value outperformed the market (Figure 4). Uncertainty is not healthy for the valuation of cyclical stocks.
Figure 4: Value’s Stronger Recovery from Volatile Periods
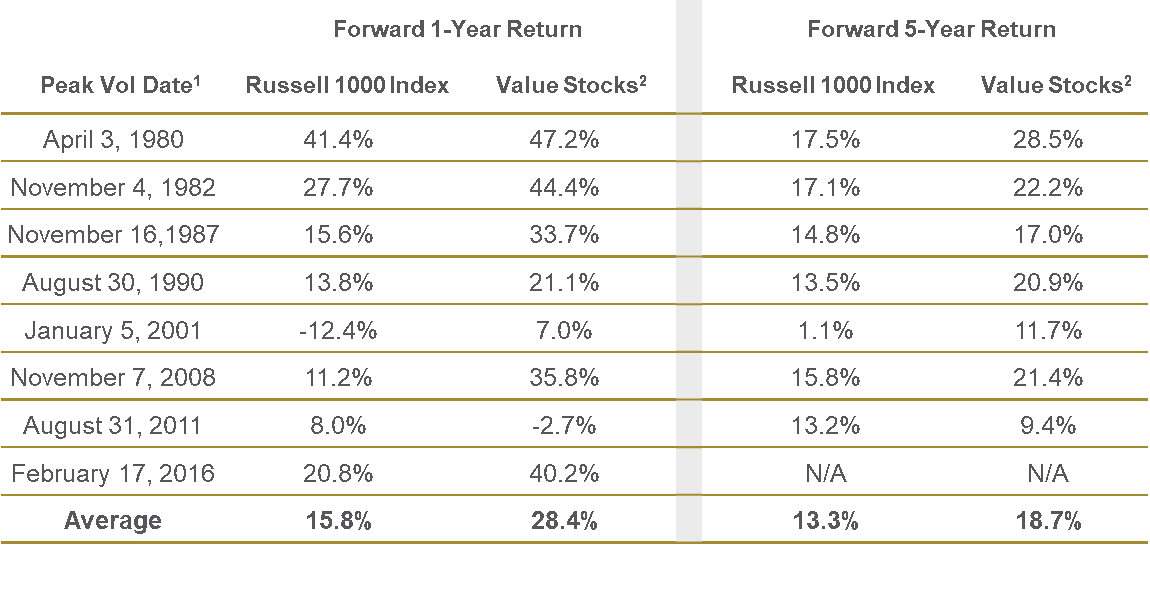
Source: Empirical Research Partners, Frank Russell Company, Sanford C. Bernstein & Co., Pzena analysis
¹Calculated using daily return volatility measured over 21-day windows within the largest ~1,000 US stocks ranked by market cap.
²Cheapest quintile price to book of the largest ~1,000 US stocks ranked by market cap.; equally-weighted returns.
All returns using monthly data and annualized in US dollars. This does not represent any Pzena product or service. Past performance is not indicative of future returns.
The 30-plus percent drawdown for equities between February and March, by the way, is not terribly different from what happened at the start of the Great Depression. While our deep value portfolios fell further than the market as investors punished businesses already out of favor, the opportunity grew greater as spreads between the cheapest and most expensive stocks blew out to some of the widest levels we’ve seen (Figure 5).
Figure 5. Unprecedented Dispersion Across the Globe
Global 1st Quintile vs. 5th Quintile Dispersion, Expressed in Standard Deviations
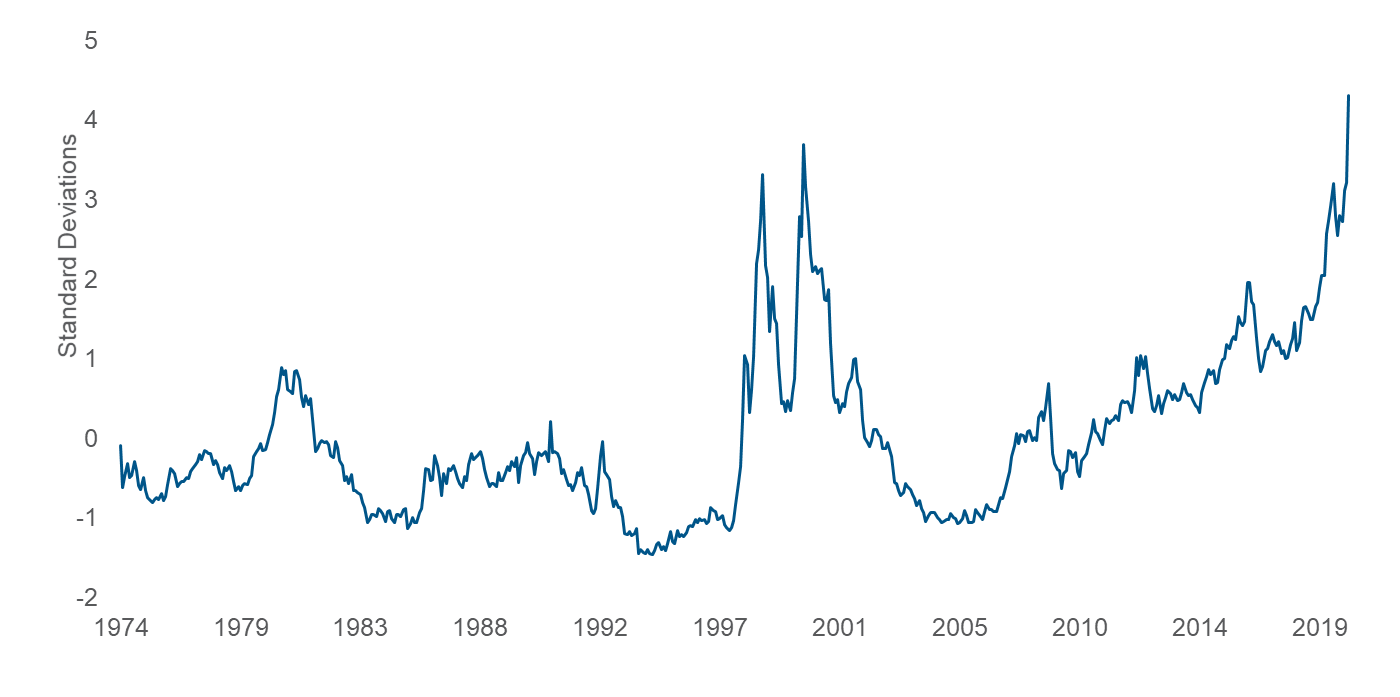
Data through March 2020. Source: Sanford C. Bernstein & Co., Pzena analysis
Dispersion based on price to book; equally-weighted data.
Universe is the MSCI World.This does not represent any specific Pzena product or service. Past performance is not indicative of future returns.
Historically, as uncertainty abates, and spreads contract, value outperforms (Figure 6). The orange dots represent periods where dispersion between the cheapest and most expensive stocks in our MSCI World universe was one standard deviation or greater. Any dot above the gold line represents value outperformance.
Figure 6. Undervalued Stocks Have Outperformed Over Time
5-Year Rolling Returns of Low Price/Book* vs. MSCI World Index 1975 – March 2020
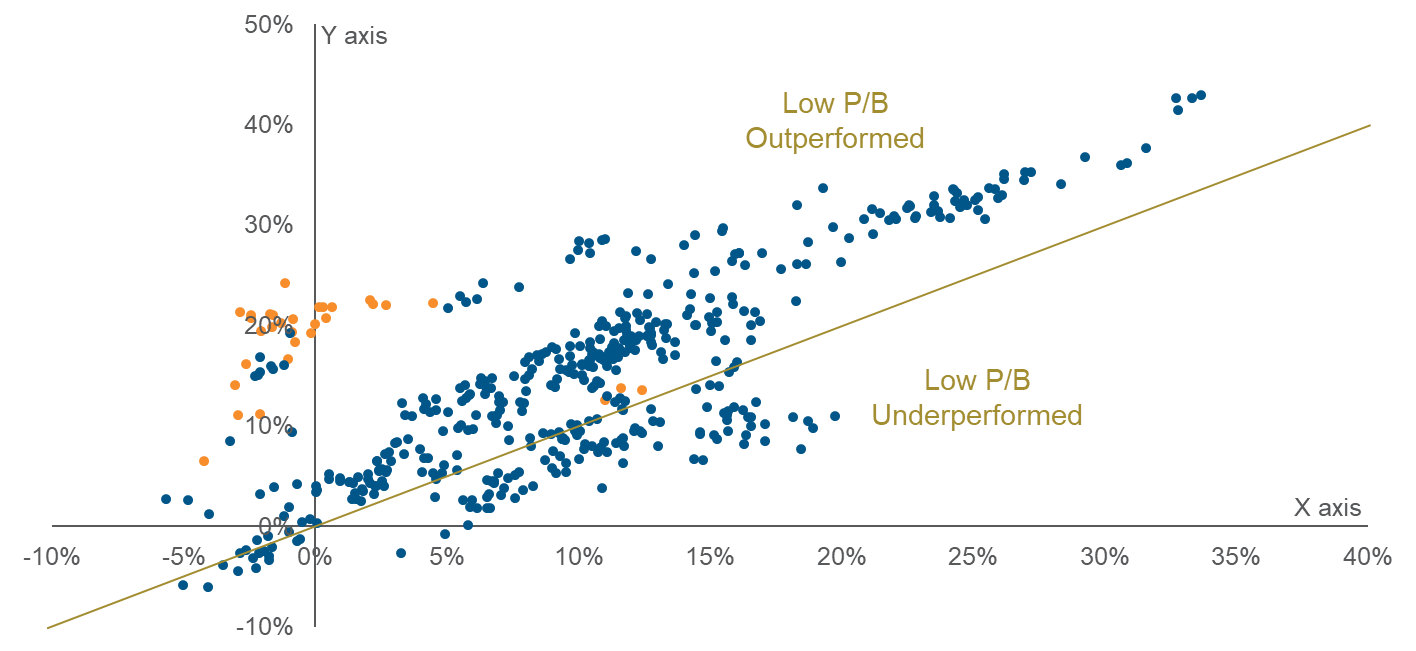
Y axis: Monthly Rolling 5-year USD annualized return of Low Price/Book*
X axis: Monthly Rolling 5-year USD annualized return of MSCI World Index
Orange dots represent starting periods where dispersion was one standard deviation or greater in MSCI World universe; dispersion is calculated using the 1st and 5th quintiles of price to book (equally-weighted data)
Source: MSCI, Sanford C. Bernstein & Co., Pzena analysis
*Cheapest quintile price to book of MSCI World universe (equally-weighted data)
This does not represent any specific Pzena product or service. Past performance is not indicative of future returns.
We believe the opportunity for value investors is similar to previous periods of significant volatility and spread widening. In fact, we see valuation opportunities that rival any in modern history for companies with strong-enough financial capacity to survive and thrive beyond the crisis. Understanding the capability of each company to withstand stress is, while always critical, worth reassessing in this environment with increased stress/downside scenarios.
You can read the original article here: Pzena – Volatility, Wide Spreads, and Value Stock Returns.
For all the latest news and podcasts, join our free newsletter here.
Don’t forget to check out our FREE Large Cap 1000 – Stock Screener, here at The Acquirer’s Multiple:

