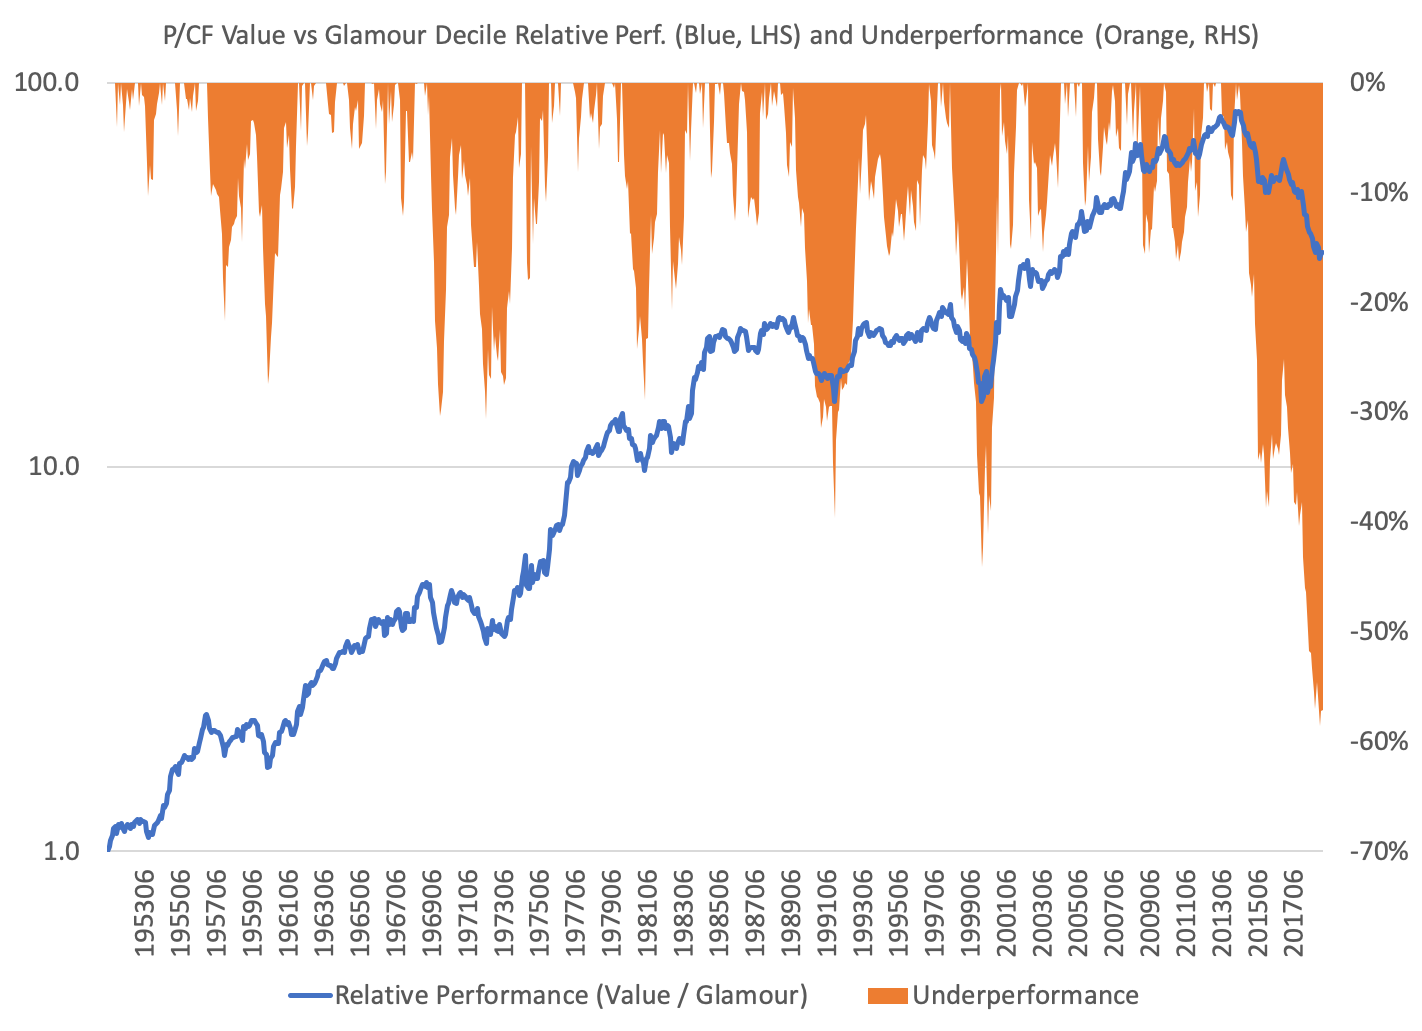
The chart below shows the relative performance (blue, left-hand side) and underperformance from the nearest peak (orange, right-hand side) of value-weighted decile portfolios formed on price-to-cash flow from 1951 to February 2019.
This is a backtest. The results are hypothetical results and are NOT an indicator of future results and do NOT represent returns that any investor actually attained. Indexes are unmanaged, do not reflect management or trading fees, and one cannot invest directly in an index.
Value is currently enduring its deepest relative underperformance ever. In December last year, the value decile of portfolios formed on P/CF hit its worst performance relative to the glamour decile *EVER* going back to 1951, underperforming by 59% since June 2014. In the latest data to February 2019, it’s recovered a little, but still underperforming to the tune of 57 percent.
The blue line (left-hand side) is relative performance, which means it shows the performance of the portfolios in the value decile–the lowest ratio of price-to-cash flow–divided by the performance of the portfolios in the glamour decile–the highest ratio of price-to-cash flow.
The orange line (right-hand side) shows the underperformance of the value decile relative to the nearest peak of outperformance when compared to the growth decile. For example, the second-worst period in the data was in the early 2000s run-up to the Dot Com peak, when value trailed glamour by 44 percent between May 1998 and February 2000.
Over the full data set, portfolios in the value decile have returned 15.4 percent on a compounded yearly basis. Glamour portfolios have returned 9.4 percent compounded, which means the value decile has typically outperformed the glamour decile by an average of 6 percent per year. Since June 2014, value has underperformed glamour by more than 10 percent per year! Toto, I’ve a feeling we’re not in Kansas anymore.
The only bright spot might be that the last time value underperformed by a very wide margin–the 44 percent from May 1998 to February 2000–the catch-up was rapid. By March 2001–14 months later–value was square with glamour–and went on to return more than 5 times the return of glamour over the following 14 years to June 2014–the last peak. (Despite the recent underperformance, value is still 2.2 times ahead of glamour since February 2000 nadir.)
At February 2019, the average market cap of stocks in the P/CF glamour portfolio was $13.2 billion versus $2.5 billion for the value portfolios. Further, the value portfolios comprised 205 firms and the glamour portfolios held 336 firms.
French Data: http://mba.tuck.dartmouth.edu/pages/faculty/ken.french/data_library.html#Research
For all the latest news and podcasts, join our free newsletter here.
Don’t forget to check out our FREE Large Cap 1000 – Stock Screener, here at The Acquirer’s Multiple:

