Updated November 29, 2017
Since the last update in July 26, 2016, the screen had a strong finish to end the 2016 year up 27.4 percent, handily beating out the Russell 1000’s 15.1 percent by 12.3 percent.
2017 to date has seen continued large cap strength. For the year, the Large Cap Screen’s 18.8 percent has outperformed the Russell 1000’s 16.9 percent by 1.9 percent.
Chart 1. Returns from January 2, 1999 to Date (Log.)
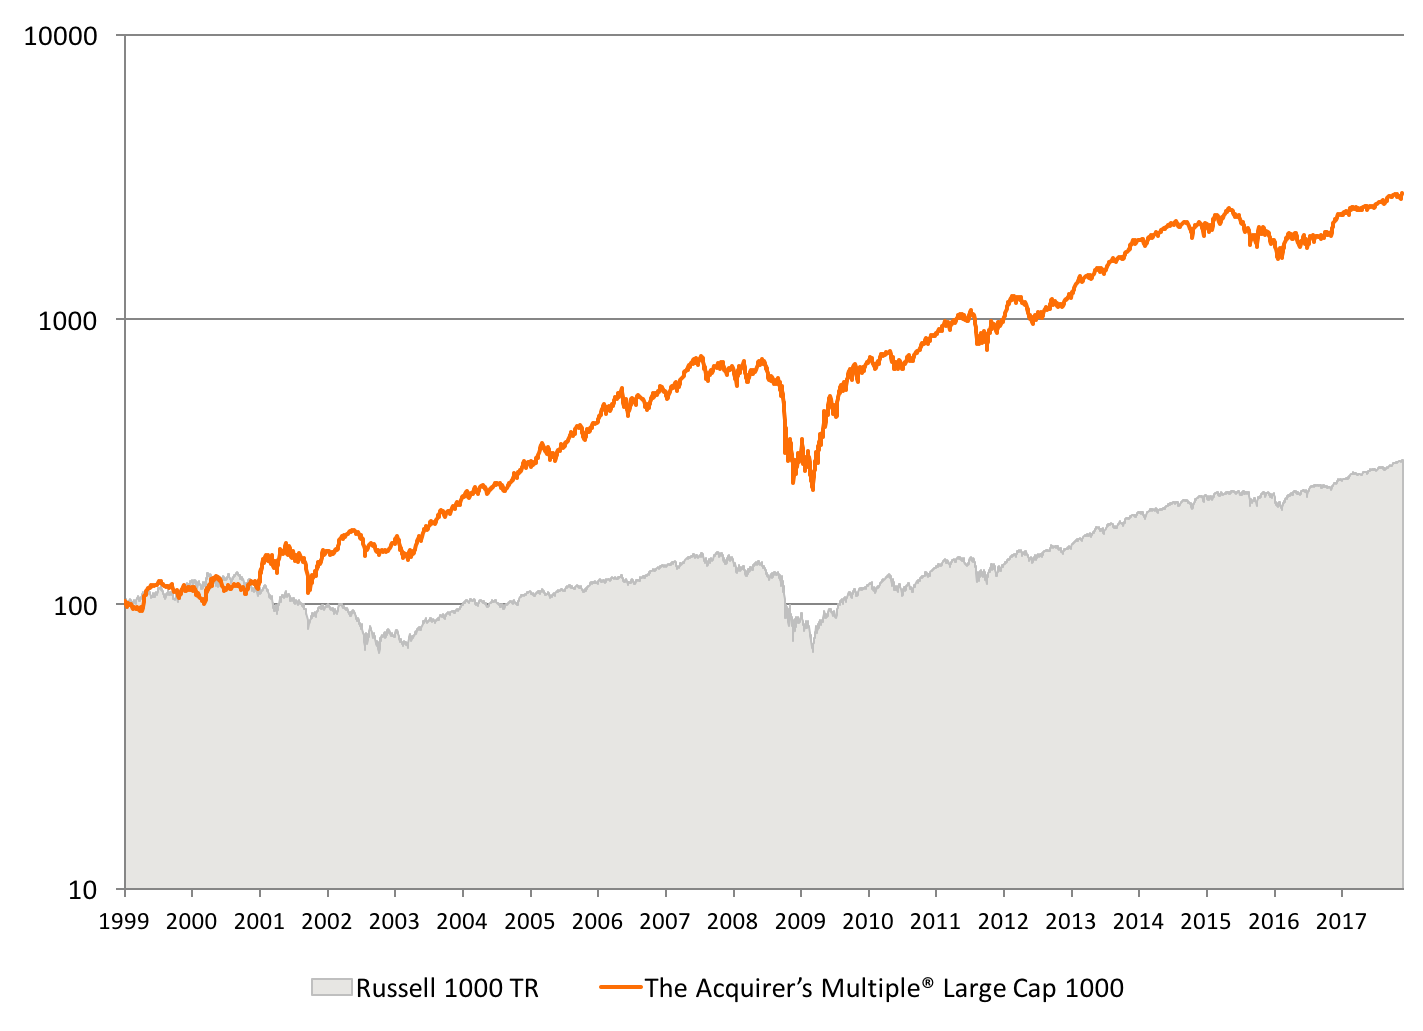
We backtested the returns to a theoretical portfolio of stocks selected by The Acquirer’s Multiple® from the Large Cap 1000 screen. The backtest assumed the screen bought and held for a year 30 stocks selected from the large cap universe (the largest 1,000 stocks by market capitalization). The screens were rebalanced on the first day of the year using the most recent fundamental data. The backtest ran from January 2, 1999 to date.
Over the full period, the screen generated a total return of 2,797 percent, or a compound growth rate (CAGR) of 19.3 percent per year. This compared favorably with the Russell 1000 Total Return, which returned a cumulative total of 320 percent, or 6.3 percent compound, over the full period.
Chart 2. Yearly Returns from January 2, 1999 to Date
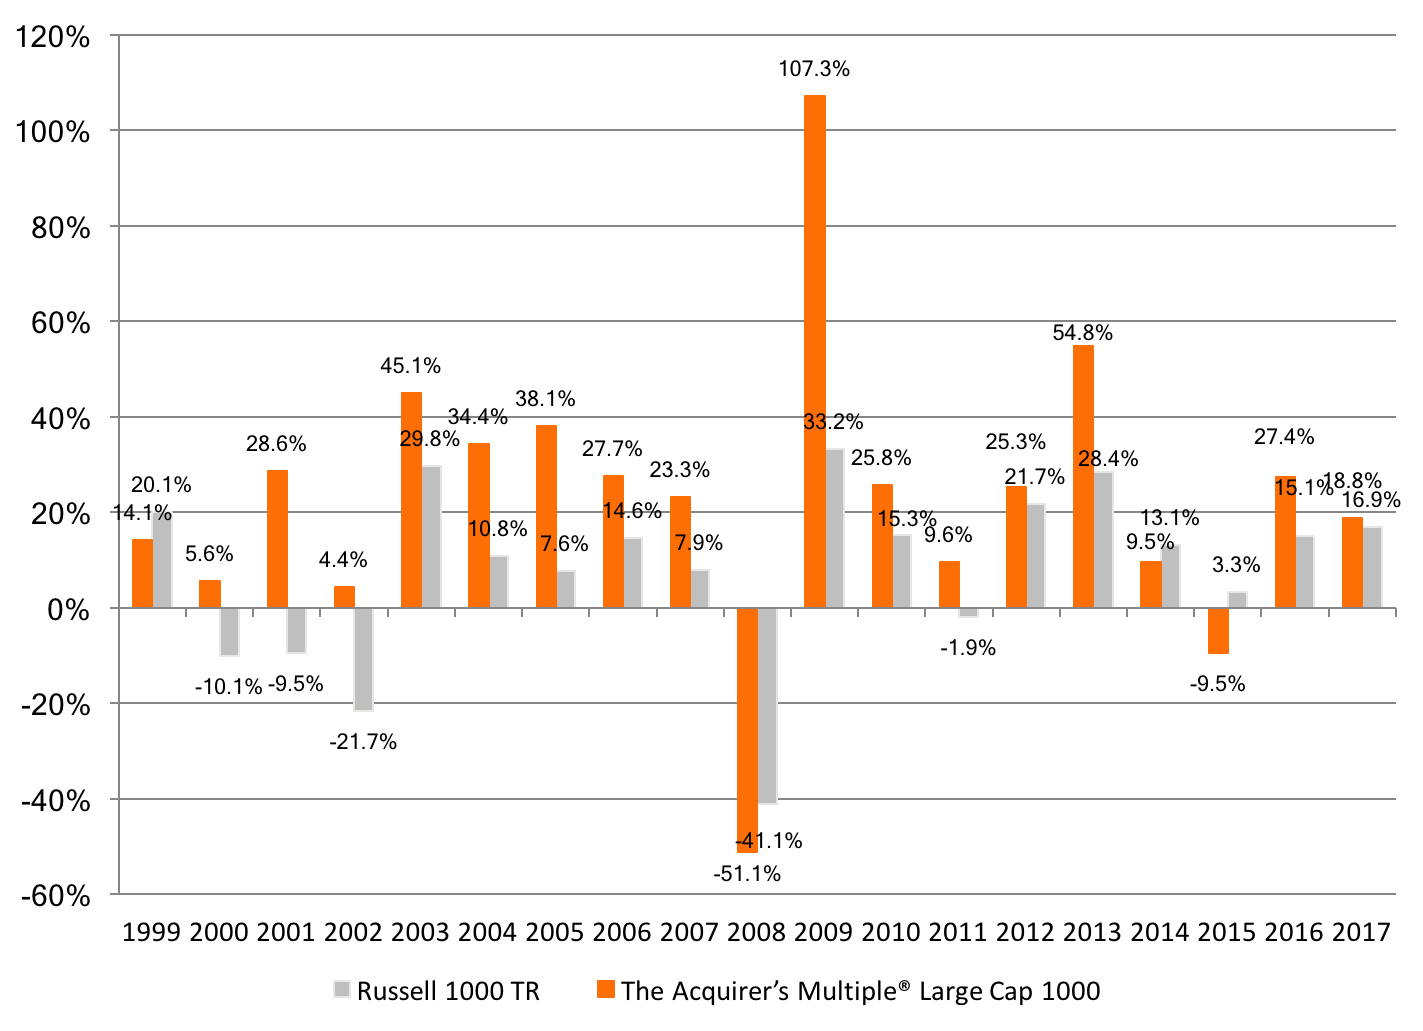
On an yearly basis, the portfolios selected by The Acquirer’s Multiple® have generally outperformed, although underperformed in 1999 (-6 percent), 2008 (-10 percent), 2014 (-3.6 percent), and 2015 (-12.8 percent).
Chart 3. Rolling Yearly Returns from January 2, 1999 to Date
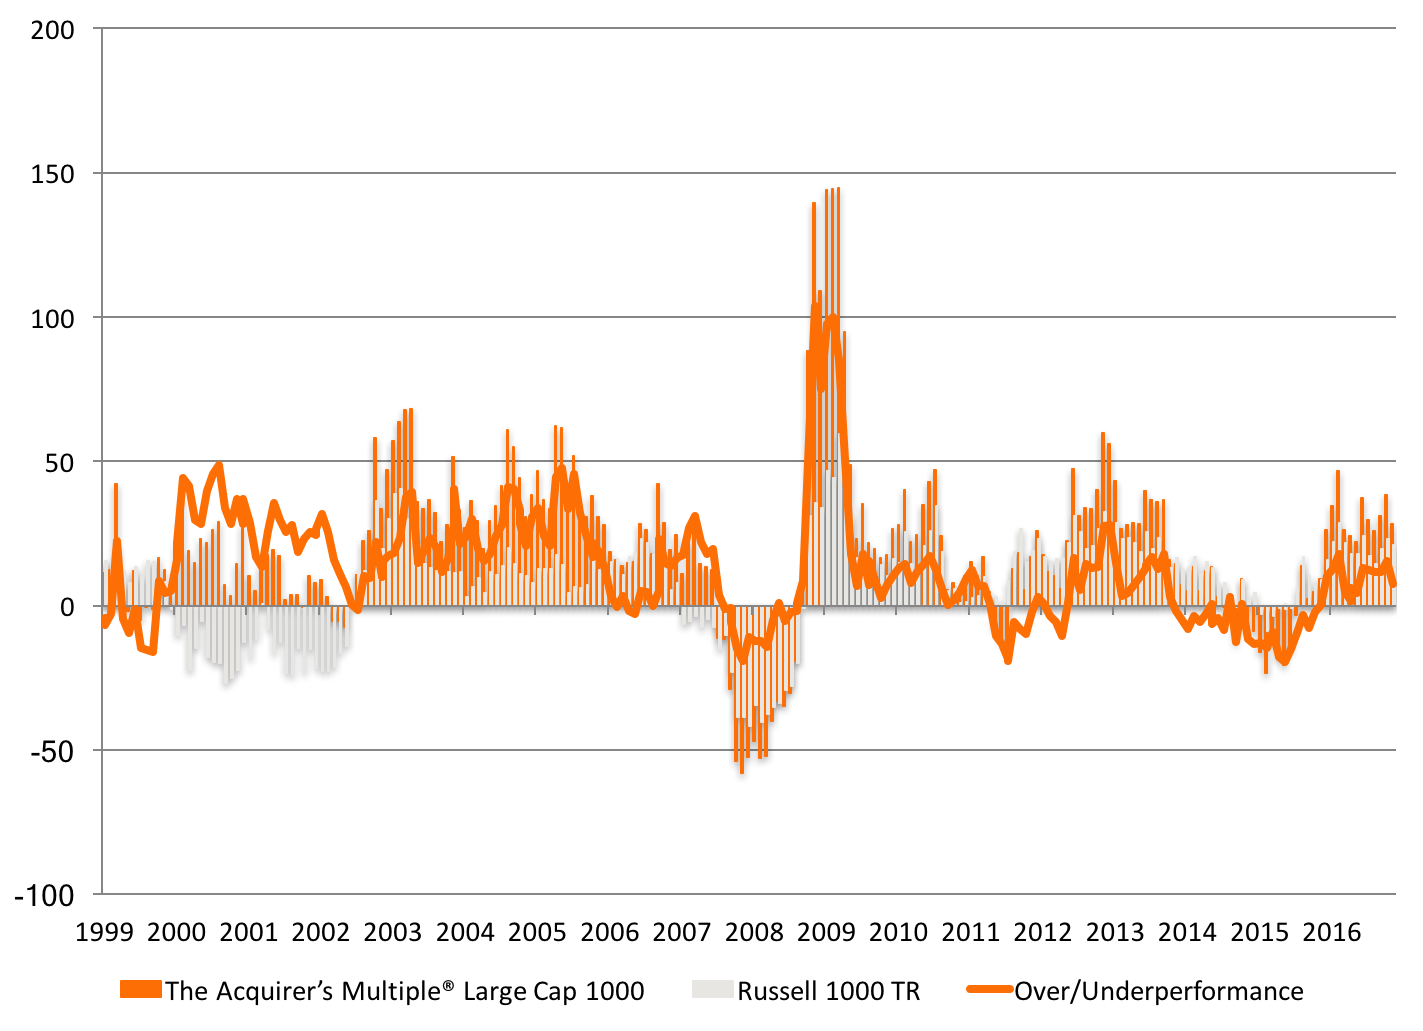
The average rolling twelve-month return for any stock selected by The Acquirer’s Multiple® during any week in any year was 20.1 percent, beating out the Russell 1000 TR’s average stock at 7.4 percent by 12.7 percent.
Chart 4. Drawdowns from January 2, 1999 to Date
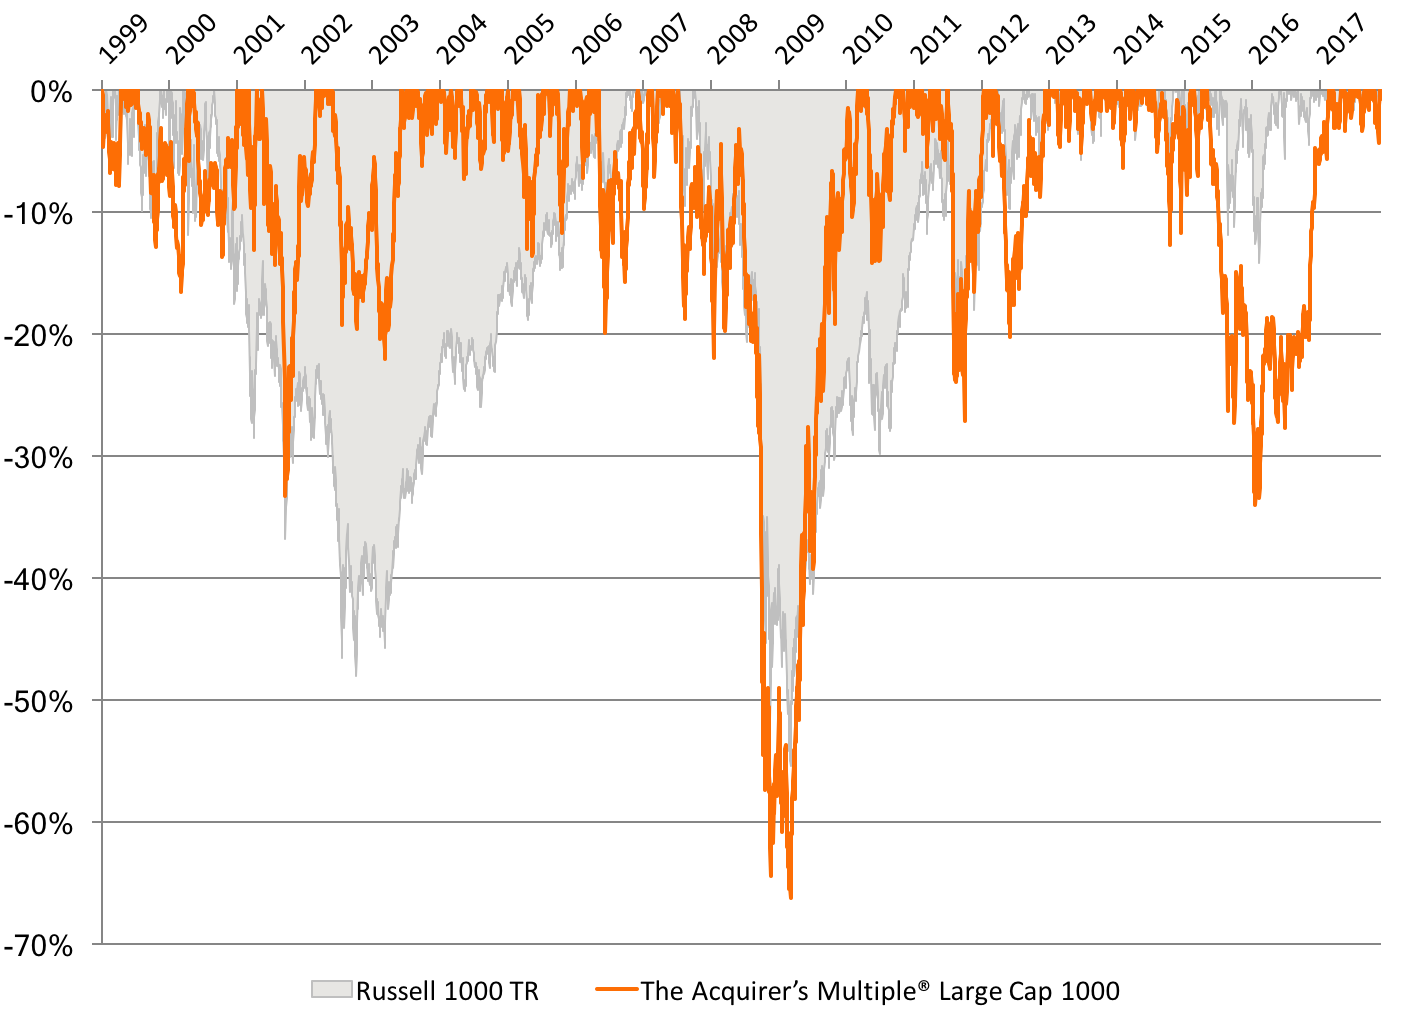
The worst drawdown for The Acquirer’s Multiple® screen was -66 percent, which occurred between July 2007 and March 2009. Over the same period the Russell 1000 TR drew down -55 percent.
The 30-stock screen selected by The Acquirer’s Multiple® from the Large Cap 1000 universe consistently outperformed the broader Russell 1000 TR. The trade off is periodic underperformance–approximately one in four years–and deeper and more frequent drawdowns.
Disclaimer: Backtested performance does not represent actual performance and should not be interpreted as an indication of such performance. Actual performance may be materially lower than that of the backtested portfolios. Backtested performance results have certain inherent limitations. Such results do not represent the impact that material economic and market factors might have on an investor’s decision-making process if the investor was actually managing money. Backtested performance also differs from actual performance because it is achieved through the retroactive application of model portfolios (in this case, The Acquirer’s Multiple®) designed with the benefit of hindsight. As a result, the models theoretically may be changed from time to time and the effect on performance results could be either favorable or unfavorable.
For all the latest news and podcasts, join our free newsletter here.
Don’t forget to check out our FREE Large Cap 1000 – Stock Screener, here at The Acquirer’s Multiple:


16 Comments on “Large Cap 1000 Stock Screen Backtest”
Tobias,
Any insights why the drawdown in 2003 was muted while 2009 was severe relative to the index? Would one be safe in assuming that drawdowns might be more than the index going forward or would the 2003 drawdown be more representative in your opinion?
Lower dispersion in 2007 compared to 2002:
Now?
Click here for more.
This is my view, but it’s worth noting that it’s an outlier. Most analysts, including Buffett, don’t think the market’s particularly expensive, and that there are lots of deals around.
Hi Tobias,
Any links to any International Screeners?
What are some of the best foreign markets right now for this type of security screening?
I’ve heard Korea is cheap and of course Russia and Greece but did your backtests work in these markets? What would be the one(s) you’d think would correlate well to this type of stock selection?
The international screener is coming. Australia looks cheap.
Hi Tobi,
could you maybe disclose the list of all symbols of the Largecap 1000 universe? I would have expected Petrobras to be in the Top 30 but am unable to determine whether the multiple is just not low enough or if it’s not contained in the universe at all.
Thanks,
Torben
Hi Torben,
Petrobras is too small for the Large Cap 1000, otherwise it is cheap enough.
Best,
Tobias
Thanks, Tobi. But Petrobras’ ~$41bn market cap is larger than many other stocks included in the Large Cap 1000. The above article suggests that the market cap is used as the metric whether or not to include in the universe…
Cheers,
Torben
It looks like $1.35 billion to me. What am I missing?
Bloomberg quotes ~USD 40.7B: http://www.bloomberg.com/quote/PBR:US
Petrobras has quite a non-trivial share structure. They have a huge amount of preferred shares as well. Maybe something went wrong when calculating the total market cap across the different share types?
I see the problem. I thought you were referring to PZE–Petrobras Argentina SA ADR–the sub. PBR is not even in my raw AM screen so I guess that means the multiple is too high.
Pingback: Deep Value Large Cap Gem – Lear Corporation $LEA | Stock Screener - The Acquirer's Multiple®
Currently, the large-cap screener lists AECOM with a positive Cash-Debt. I believe this is an error. According to last Q10, cash is less than 1bn, debt is more than 4bn. I think the long-term debt (3.7bn) was not included in the calculation.
Hi Tobi,
I was wondering if could expect seeing an update to your Large Cap 1000 backtest? I believe the performance update was in November 2017.
Thank you very much,
Julien Dion
We’re working on it.
I have been applying AM in the European market for a few years now. It might be specific to this market, but I observed that a noticeable portion of screener results have a low free float percentage (<40%). Obviously the chances for activist investors might be limited to pressure significant changes in such situation.
I was wondering whether it might make sense to backtest the universe against one that requires free float above a certain threshold? What's your opinion on this one?
I’ve tested both high and low float. It doesn’t make a difference to returns.