Updated November 29, 2017
Since the last update in July 26, 2016, the screen had a strong finish to end the 2016 year up 29.1 percent, handily beating out the Russell 3000’s 12.2 percent by 16.9 percent.
2017 to date has been less pleasant. For the year, the All investable Screen has gone backwards, down -6.6 percent, and underperforming the Russell 3000’s strong 16.3 percent by a shocking -22.4 percent. This is the worst relative performance the screen has seen in almost 20 years.
Chart 1. Returns from January 2, 1999 to Date (Log.)
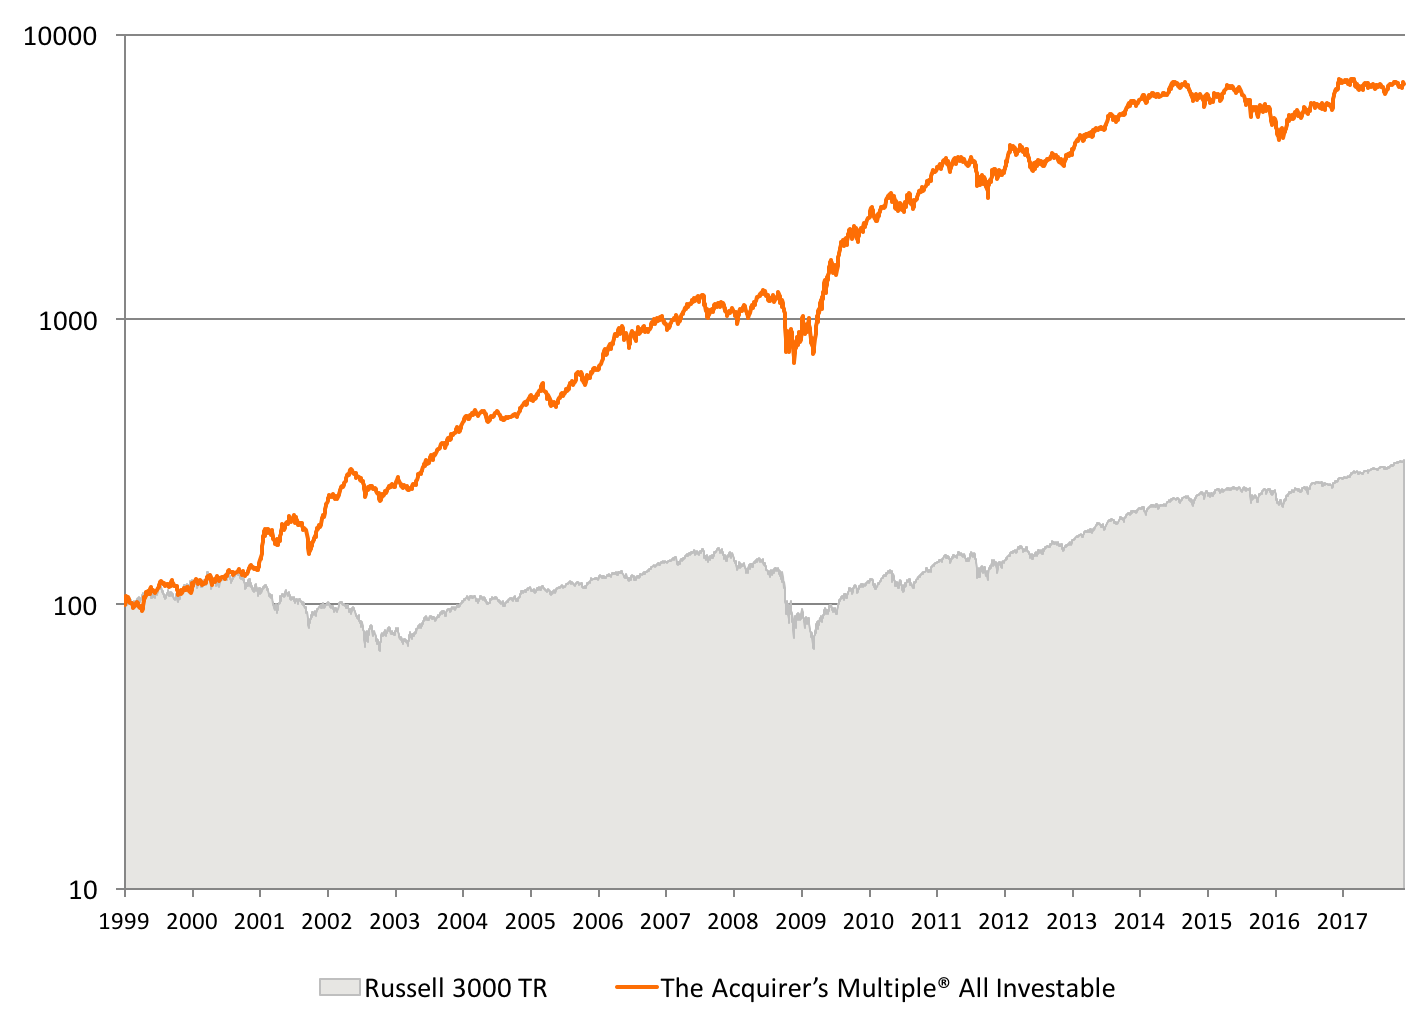
We backtested the returns to a theoretical portfolio of stocks selected by The Acquirer’s Multiple® from the All Investable stock screen. The backtest assumed the screen bought and held for a year 30 stocks selected from the All Investable universe (the largest half of stocks by market capitalization). The portfolios were rebalanced on the first day of the year using the most recent fundamental data. The backtest ran from January 2, 1999 to date.
Over the full period, the screen generated a total return of 6,765 percent, or a compound growth rate (CAGR) of 25.0 percent per year. This compared favorably with the Russell 3000 TR, which returned a cumulative total of 321 percent, or 6.4 percent compound.
Chart 2. Yearly Returns from January 2, 1999 to Date
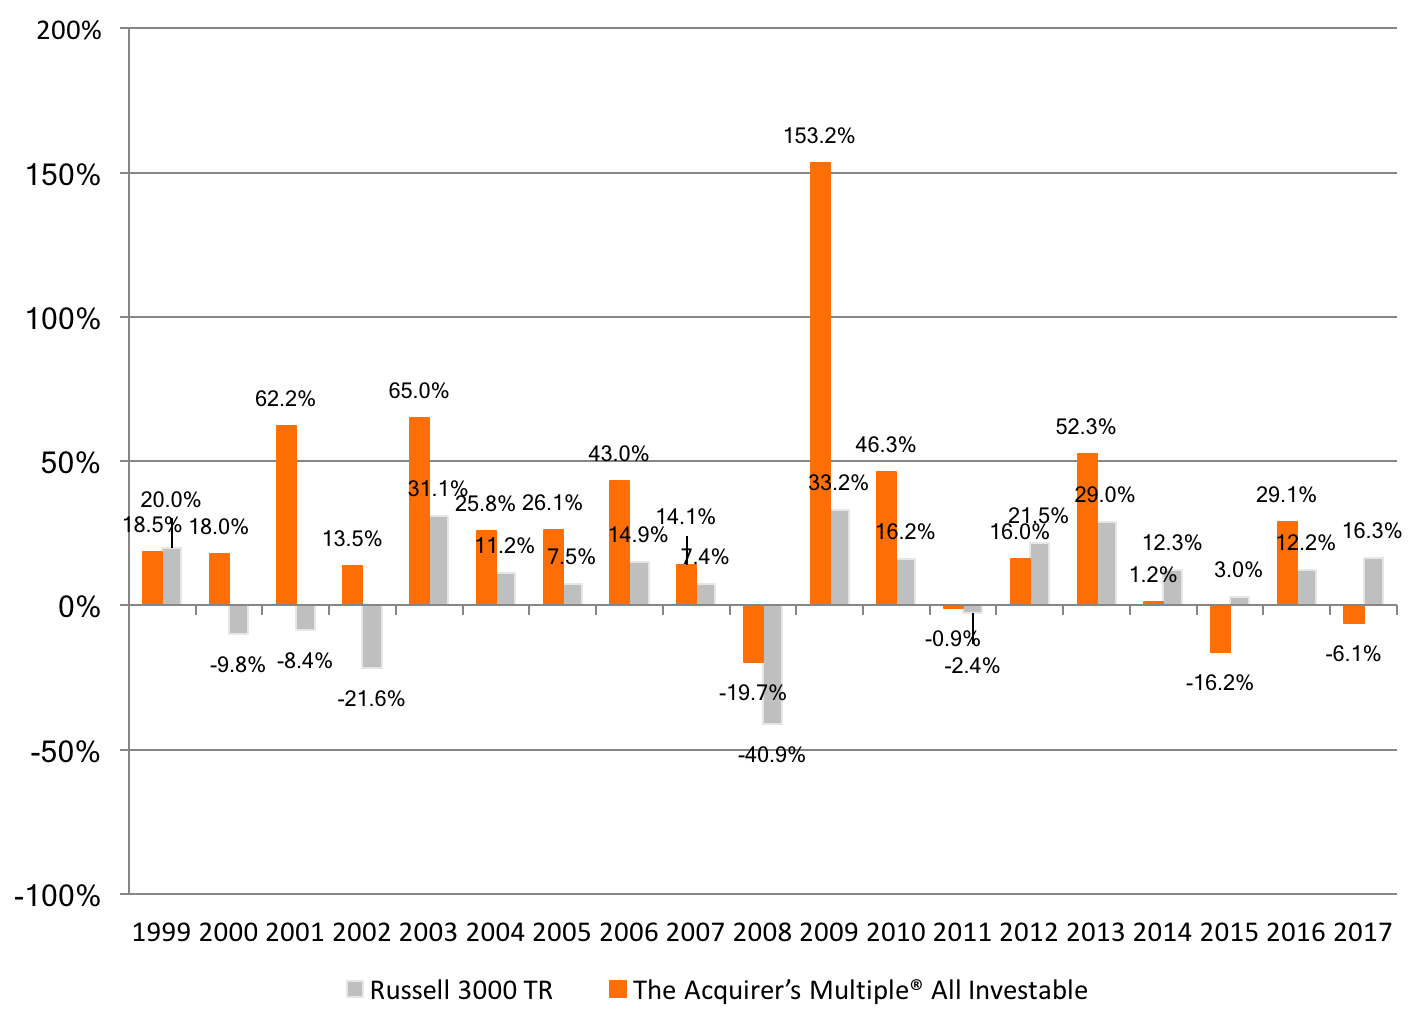
On an yearly basis, the model portfolios selected by The Acquirer’s Multiple® have generally outperformed, although underperformed in 1999 (-1.6 percent), 2012 (-5.5 percent), 2014 (-11.1 percent), 2015 (-19.2 percent), and 2017 to date (-22.4 percent).
Chart 3. Rolling Yearly Returns from January 2, 1999 to Date
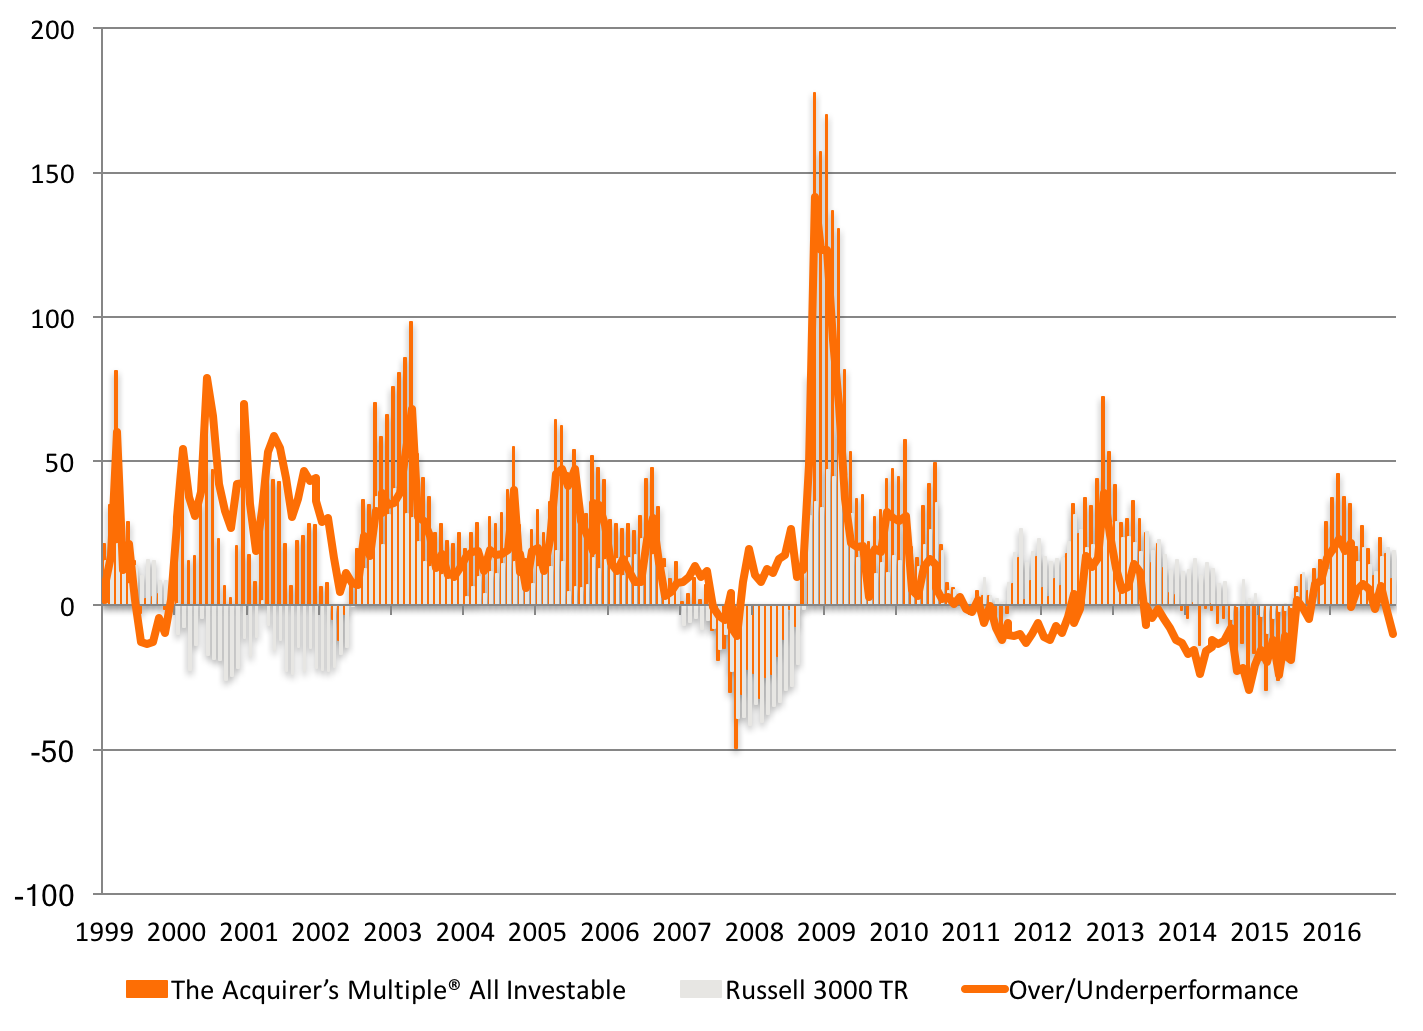
The average twelve-month return for any stock selected by The Acquirer’s Multiple® All Investable screen was 22.6 percent, beating out the Russell 3000 TR’s average stock at 7.4 percent by 15.2 percent. Through The Acquirer’s Multiple® portfolios underperformed from mid-2011 through to mid-2012, then mid-2013 through to early 2016, and again since early 2017, they still slightly outperformed over the full period.
Chart 4. Drawdowns from January 2, 1999 to Date
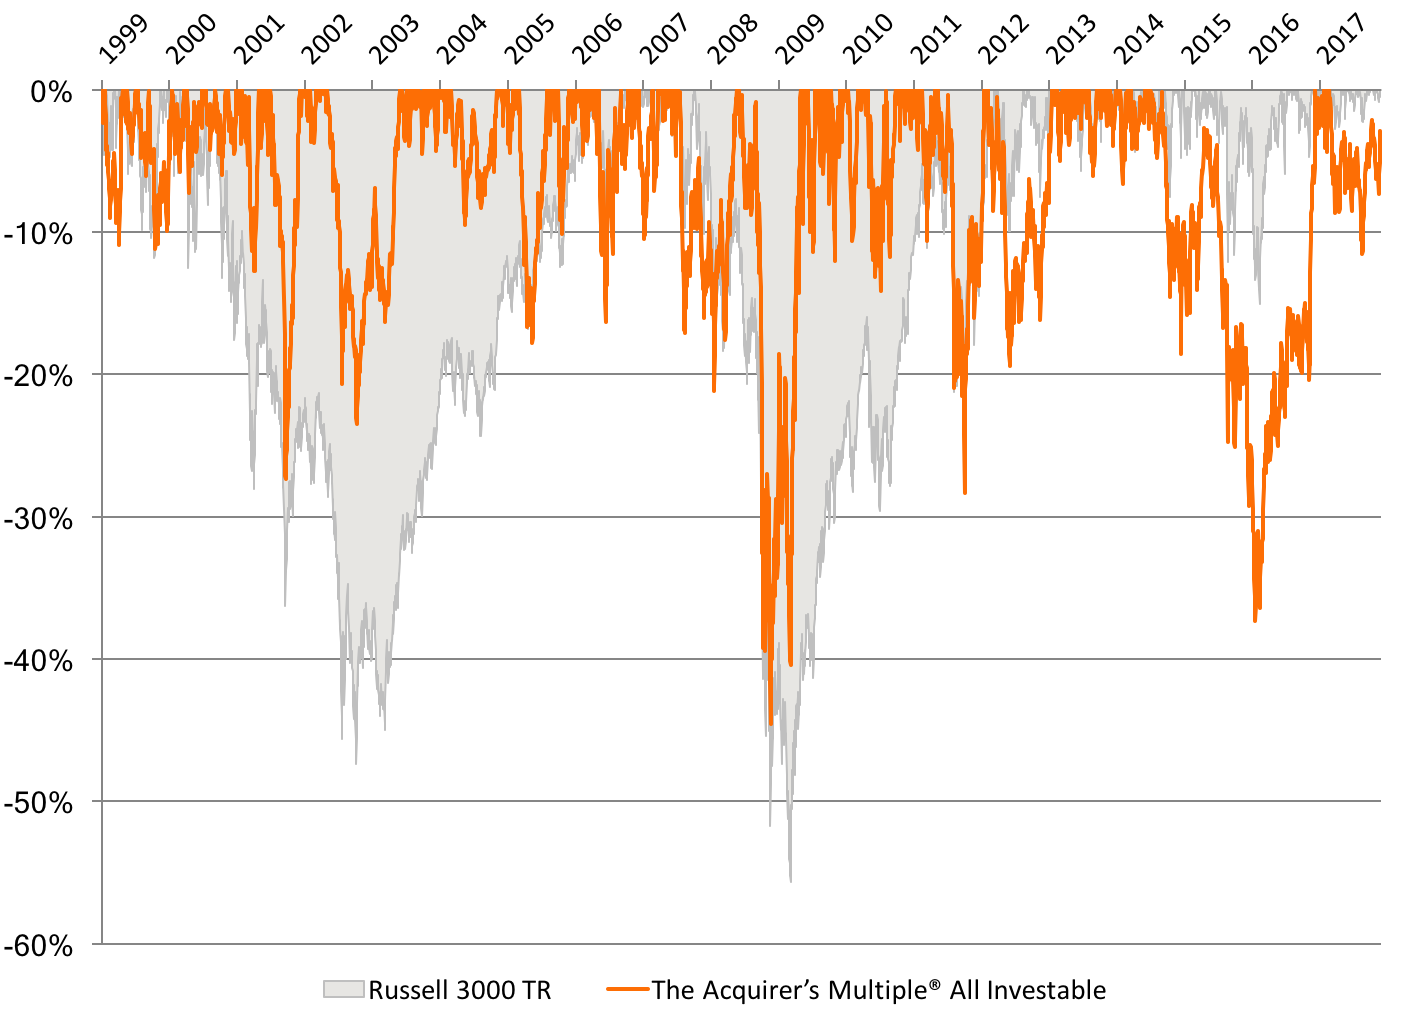
The worst drawdown for The Acquirer’s Multiple® All Investable screen was -45 percent, which occurred between July 2007 and March 2009. Over the same period, the Russell 3000 TR drew down -56 percent.
The 30-stock portfolios selected by The Acquirer’s Multiple® from the All Investable universe consistently outperformed the broader Russell 3000 TR. The trade off is periodic underperformance–approximately one in four years–and deeper and more frequent drawdowns.
Disclaimer: Backtested performance does not represent actual performance and should not be interpreted as an indication of such performance. Actual performance may be materially lower than that of the backtested portfolios. Backtested performance results have certain inherent limitations. Such results do not represent the impact that material economic and market factors might have on an investor’s decision-making process if the investor was actually managing money. Backtested performance also differs from actual performance because it is achieved through the retroactive application of model portfolios (in this case, The Acquirer’s Multiple®) designed with the benefit of hindsight. As a result, the models theoretically may be changed from time to time and the effect on performance results could be either favorable or unfavorable.
For all the latest news and podcasts, join our free newsletter here.
Don’t forget to check out our FREE Large Cap 1000 – Stock Screener, here at The Acquirer’s Multiple:


11 Comments on “All Investable Stock Screen Backtest”
Hi Tobias,
Thank you for your response to my question on the small cap screener. I am working my way through your book Quantitative Value. A few questions on the All Investable Stock Screen Backtest if I may:
1) On page 72, you write that when an academic takes an idea to Wall Street, the effect vanishes or diminishes. Thanks in part to your excellent book, should we not be concerned that the excess returns stemming from the enterprise multiple will “vanish or diminish”? Could (or has ) this strategy become a victim of its own (backtested) success? Over the past 4 years, the excess CAGR has (dare I say) diminished to ~2.5% vs nearly 20% over the entire backtesting period of 1999-2014.
2) What would the backtested returns have looked like had you chosen a rebalance date of June 30th? As you state on pg 197, should we be concerned you state a that a portfolio rebalanced on January 1st introduces “look-ahead” bias…
3) Is the backtested All Investable Stock Screen portfolio equal or market weighted?
Thank you!
Sam
Hi Sam,
1) The returns to the enterprise multiple have certainly diminished, as have the returns to all value metrics. This is the reason value investing continues to work: Low returns will cause investors to abandon the strategy, which will ensure that it continues to work. We may need a shakeout for that to come to fruition.
2) Rather than picking another arbitrary date like June 30th, the rolling returns are the best way of dealing with look-ahead bias. The rolling returns demonstrate that the acquirer’s multiple is robust, albeit suffering from the same diminution of returns you identified in 1).
3) Equal weighted.
Thanks for the questions.
Best,
Tobias
Hi Tobias,
What were the returns in 2015 for this and the other two portfolios?
Thanks,
Eric
Pingback: Last chance to take advantage of extended offer: One month trial of The Acquirer’s Multiple for 9 bucks (save $40) | Stock Screener - The Acquirer's Multiple®
Pingback: Subscribe to The Acquirer’s Multiple and pay only 9 bones for the first month (Expires midnight tonight) | Stock Screener - The Acquirer's Multiple®
Pingback: Special offer this weekend only: One month trial of The Acquirer’s Multiple for 9 bucks (Save $40) | Stock Screener - The Acquirer's Multiple®
Pingback: How Did The Top 30 Deep Value Large Cap US Stocks Perform This Week? | Stock Screener - The Acquirer's Multiple®
Pingback: The Bible On Capital Allocation plus His Checklist - Michael Mauboussin | Stock Screener - The Acquirer's Multiple®
Pingback: The Acquirer’s Multiple $45,000 – Deep Value Stock Portfolio – Real Money Game | Stock Screener - The Acquirer's Multiple®
Pingback: Finding Deep Value Stocks with the Acquirer's Multiple – Validea's Guru Investor Blog
Hi Tobias,
I have a question regarding the strategy.
I am residing in a tax free location, so taxes are not an issue.
I was wondering if you have done any testing with a concentrated portfolio (e.g. top 10 stocks) with quarterly re-balancing. Do this tend to improve returns? Though I guess volatility will be higher but quarterly re-balance should contain some of the volatility.
Thanks